顧客のターゲティングには、顧客ターゲティングは、

地理的ターゲティング(Geographic Targeting)
デモグラフィックターゲティング(Demographic Targeting)
行動ターゲティング(Behavioral Targeting)
心理グラフィックスターゲティング(Psychographic Targeting)
利用履歴ターゲティング(Usage-based Targeting)
社会的ターゲティング(Social Targeting)

などがありますが、実践的には、大きく2つの方法があります。

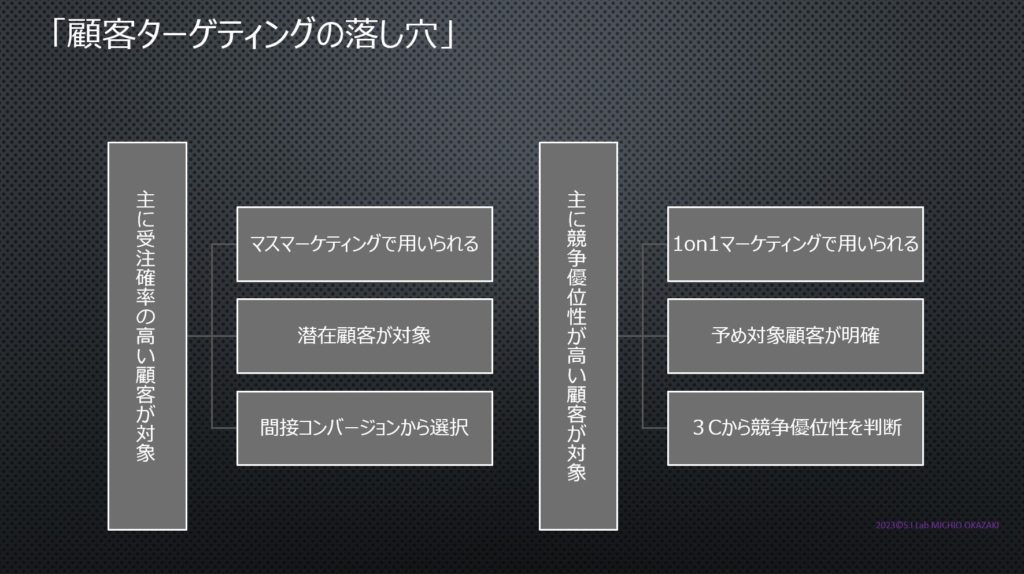
一つは、マーケティングオートメーションで行われる、受注確率の高い顧客をターゲットにする方法。

もう一つは、3Cの視点から競争優位性を得られる顧客をターゲットにする方法です。

これは対象となる顧客が予め明確な1on1マーケティングで活用されます。

顧客ターゲティングで陥りやすいのは、単に市場規模や自社売上の大きな顧客を優先ターゲットにしてしまうことです。

これでは顧客タイプや競合状況の異なる顧客が混在してしまうために、ビジネスプランが当てはまらず、無駄にリソース量が増大する割にはリターンが得られにくくなってしまいます。

“The Pitfalls of Customer Targeting”

When it comes to customer targeting, there are various methods such as geographic targeting, demographic targeting, behavioral targeting, psychographic targeting, usage-based targeting, and social targeting.

However, in practical terms, there are two major approaches:

One is to target customers with a high probability of conversion, often implemented through marketing automation.

The other is to target customers who can provide competitive advantage from a 3C perspective (Customer, Company, Competitor).

This is used in 1on1 marketing where the target customer is clear in advance.

A common trap in customer targeting is prioritizing customers solely based on market size or the company’s own sales figures.

This approach leads to a mixture of customer types and different competitive scenarios, rendering business plans ineffective and causing resource allocation to increase without proportionate returns.

あなたは、今期より新規市場参入する新製品のプロマネです。

今期の目標売上高は100億円と社長から言われています。

果たして達成は可能でしょうか?

もし参入する市場規模が100億円市場であればシェア率100%となり、競合不在の市場であっても初年度からは実現困難でしょう。

では市場規模が200億円ならどうでしょう。

シェア率50%となり、競合が存在する場合にはいきなりTopの競争地位を獲得することになります。

では市場規模が400億円ならいかがでしょうか。

シェア率25%はよほど製品力がない限り、初年度からは少し難しいかもしれません。

市場規模が1400億円なら、シェア率7%になり、競合ひしめく競争市場でもなんとか達成出来るかもしれません。

シェア目標値が7%に決まれば、7%を獲得するためのSTPを決めることになります。

7%を達成すれば、次は11%、19%と目標シェア値を上げるに従って、該当するSTPを設定します。

このように市場を細分化し、特定地域への集中的な投資により、占有率や知名度において競合よりも優位に立つことで市場を拡大する手法がドミナント戦略です。

駅を中心に出店するマツモトキヨシが有名ですね。

“Market Lifecycle and Dominant Strategy”

You are the project manager responsible for launching a new product in a new market this fiscal year.

The target sales for this fiscal year have been set at 10 billion yen by the company president.

Is achieving this goal truly possible?

If the market size for the entry is 10 billion yen, with a 100% market share, even in a market devoid of competitors, it might be challenging to achieve in the first year.

Now, consider a market size of 20 billion yen.

With a 50% market share, if competitors exist, you wouldn’t instantly secure a top competitive position.

What if the market size is 40 billion yen?

A 25% market share might be somewhat difficult to attain in the first year unless the product has exceptional features.

If the market size were 140 billion yen, capturing a 7% market share might be achievable, even in a crowded competitive market.

Once the 7% market share goal is set, you’ll need to determine the Segmentation, Targeting, and Positioning (STP) strategy to achieve it.

Once you achieve 7%, you can aim for 11%, 19%, and higher market shares, adjusting your STP strategy accordingly.

This approach involves segmenting the market, concentrating investments in specific regions, and gaining a competitive advantage in terms of market share and brand recognition, thereby expanding the market. This strategy is known as the Dominant Strategy.

An example of this is Matsumoto Kiyoshi, which strategically opens stores around train stations to gain dominance and recognition in the market. 

国内の医療環境では、高齢化や医療費の増加が懸念されており、医療費を抑える有効な手段として後発医薬品の利用があります。

厚生労働省は、医療費の抑制や患者への負担軽減を図るために後発医薬品の普及を支援しています。

公衆衛生の観点からも、個々の患者の治療だけでなく、社会全体の健康を考えなければなりません。

医療資源を効果的に活用し、多くの患者に適切な治療を提供するために、低価格の薬剤を選択することは必要です。

一方で特許切れによる後発医薬品の登場は、先発医薬品メーカーの業績悪化の大きな要因となります。

後発医薬品の積極的な使用は、医療費削減や健康保険制度の枠組み、規制の整備など、多くの要因が絡み合っています。

社会的責任が高い製薬企業としての立場と、自由競争のもと、民間企業として経営に対するあらゆる自己責任を担うべき存在としての立場から、今後も持続的な成長を続けるための最適解を見つける必要がありそうです。

“Reasons for Choosing Low-Priced Products: Perspectives from Government and Healthcare Professionals”

In the domestic healthcare landscape, concerns over aging populations and rising medical expenses have prompted the utilization of generic pharmaceuticals as an effective means to control healthcare costs.

The Ministry of Health, Labour and Welfare supports the proliferation of generic pharmaceuticals to mitigate healthcare expenses and alleviate the burden on patients.

From a public health standpoint, considerations extend beyond individual patient care to encompass the overall health of society.

To efficiently allocate medical resources and provide suitable treatments to a broader patient base, opting for low-priced pharmaceuticals becomes imperative.

On the other hand, the emergence of generic pharmaceuticals due to patent expirations significantly contributes to the decline in the performance of originator pharmaceutical manufacturers.

The proactive utilization of generic pharmaceuticals intertwines various factors, including healthcare cost reduction, the framework of health insurance systems, and regulatory enhancements.

Balancing the position of socially responsible pharmaceutical companies with the role of assuming full accountability for management as private entities operating within a framework of free competition seems crucial for sustaining continuous growth moving forward. 

① 顧客のターゲティングが不正確では、無駄にリソースを消耗し、真のターゲット顧客とのエンゲージメントを構築することが出来ません。

② 競争市場には必ず競合が存在するために、リソース量で競合を上回る必要があります。

③ 顧客ニーズが多様化しているために、個別最適化されたメッセージが必要です。

DXsStratifyはこの3つのRを可視化および定量化することが出来ます。

SFA/CRMはリード育成と選定の後のフェーズを効率化する支援ソリューションです。

そのため、リード育成と選定の精度を上げることで、SFA/CRMの精度を高めることが出来ます。

“Four Rs of Marketing and DXsStratify”

Inaccurate customer targeting results in wastage of resources and an inability to establish engagement with the actual target customers.

In competitive markets, the presence of competitors necessitates surpassing them in terms of resource allocation.

Due to the diversification of customer needs, individually tailored messages are imperative.

DXsStratify can visualize and quantify these three Rs.

SFA/CRM is a supporting solution that streamlines the phases after lead nurturing and selection.

Therefore, by increasing the accuracy of lead development and selection, it is possible to improve the accuracy of SFA/CRM.

マーケティングには4つの大切なRがあるとされています。

① Right customer priority
② Right frequency
③ Right message
④ Right timing

しかし、この4つのRを決めるための前提条件があります。

この前提条件の解像度が低く不正解では、ナビゲーションに誤った目的地を設定することと同じです。

すなわち100%の確率で誤った目的地に到着します。

デジタルアプリケーションのDXsStratify(商標登録中)は、医薬品販売データから①~③の前提条件を分析し、可視化および定量化することが出来ます。

ですが、残念ながら④つ目のRはDXsStratifyでは導き出すことが出来ません。

実際の活動結果のデータを用いて、SFA/CRMによって知ることが出来ます。

繰り返しますが、①~③の前提条件が不正解なまま、④の活動を行っても正しい目的地には辿り着くことは出来ません。

“Four Essential Rs in Marketing and Their Prerequisites”

In the realm of marketing, there are four crucial Rs that are often emphasized:

Right customer priority
Right frequency
Right message
Right timing

However, there are prerequisites to determine these four Rs.

The resolution of these prerequisites is akin to setting the wrong destination in navigation; if the resolution is low or incorrect, it leads to arriving at the wrong destination with 100% certainty.

Digital application DXsStratify (trademark pending) can analyze, visualize, and quantify the prerequisites of 1 through 3 by analyzing pharmaceutical sales data.

Unfortunately, the fourth R cannot be derived using DXsStratify.

Real-world performance data can be obtained through Sales Force Automation (SFA) and Customer Relationship Management (CRM) tools.

Again, if the preconditions ① to ③ are incorrect, even if you perform the activity ④, you will not be able to reach the correct destination. 

自社製品を競合他社よりも低い価格で提供することで、新規顧客を獲得しやすくなります。

新規顧客を獲得することは市場シェアを拡大することにつながるために、低価格戦略は一般的に行われます。

しかし、競合同士が低価格を争う状況が続くと、企業の収益が減少し、サービスの品質や新しい技術への投資が十分に行われなくなる危険性があります。

顧客は安い価格だけでなく、品質や信頼性も重視することがあるため、単に価格を下げるだけでは十分な結果を得られないこともあります。

価格を決めるのは需要と供給だけでなく、消費者の好みやトレンド、広告、ブランド価値なども価格に影響を与える要因です。

そのため、自社と競合の視点だけではなく、顧客にも目を向ける必要があります。

新規顧客の獲得には価格の影響が強い傾向ですが、自社とのエンゲージメントが進み、ロイヤルカスタマーに育成することが出来れば価格の影響を受けにくい安定市場を築くことが出来ます。

マトリクス分析法は3Cの視点から、自社の市場安定性をロイヤルカスタマー比率から可視化および定量化します。

“Royal Customers Are Insensitive to Prices”

By offering products and services at lower prices than competing companies, it becomes easier to acquire new customers.

The acquisition of new customers generally leads to expanding market share, which is why the strategy of offering lower prices is commonly employed.

However, when a situation of ongoing price competition among competitors persists, there is a risk of decreased company revenue and insufficient investment in service quality and new technologies.

Customers not only value affordable prices but also prioritize quality and reliability. Therefore, simply reducing prices might not yield satisfactory results.

Setting prices is influenced not only by supply and demand but also by consumer preferences, trends, advertising, brand value, and other factors.

Hence, it’s crucial to focus not only on one’s own perspective and that of competitors but also on the customers’ viewpoint.

While the influence of price tends to be significant in acquiring new customers, if engagement with the company deepens and if it’s possible to cultivate loyal customers, a stable market less susceptible to price fluctuations can be established.

The Matrix Analysis method visualizes and quantifies the company’s market stability from the perspective of the 3Cs (Customers, Competitors, Company) using the ratio of loyal customers. 

戦後の高度経済成長期以前の体験を記憶している現役の方は、現在のビジネスの現場にはおられないと思います。

「先行きが不透明で、将来の予測が困難な状態」をVUCAと言いますが、我々は誰も経験をしたことがないビジネス環境に立っています。

この10年間の世界の不確実性指数は、実に3.5倍に高まっています。

その大きな要因は世界的な景気後退による市場の縮小です。

そのため、より競争の厳しい市場環境になりました。

私たちが用いているビジネスモデルの多くは、市場が拡大する時期に提唱されたものが殆どであり、競争市場には必ずしも合致していません。

未来を予測するよりも、現状を把握し、変化に柔軟で俊敏に対応することが求められています。

“Embracing the Unpredictable Future in the Present”

Those who remember the era before the post-war period of rapid economic growth are likely not actively engaged in today’s business landscape.

Referred to as VUCA, an acronym for “Volatility, Uncertainty, Complexity, and Ambiguity,” the concept describes a state of affairs where the future is opaque and predicting outcomes becomes challenging. We find ourselves standing in a business environment that none of us have experienced before.

The global uncertainty index over the past decade has escalated by a staggering 3.5 times.

A significant contributing factor to this shift is the contraction of markets due to worldwide economic downturns.

Consequently, our operating within a more fiercely competitive market has become the new norm.

Many of the business models we employ were conceptualized during periods of market expansion and might not align seamlessly with the landscape of competitive markets.

Rather than attempting to predict the future, the emphasis is on understanding the present circumstances and swiftly adapting to changes with flexibility and agility.

潜在的な顧客を対象にしたマスマーケティングを、より効率化するためのデジタルリソースであるマーケティングオートメーションは、購入確率の高い顧客を抽出し、営業活動による獲得率を向上させることが出来ます。

しかし、医師による処方を必要とする医療用医薬品マーケティングでは、予めターゲット顧客が明確な1on1マーケティングです。

そのため、ネットによるマーケティングオートメーションでは、ネットへのアクセスの少ない重要な顧客をロストしてしまう危険性があります。

そのため、処方意向のある顧客だけではなく、処方意向の低い顧客を処方行動に促す必要があります。

ダミーデータによるマトリクス分析(特許取得済)の結果から真のターゲット顧客を抽出することが出来るのか検証してみましょう。

当該市場は、シェア28%の競合製品A、シェア25%の自社製品、シェア24%の競合製品Bによる3強型市場を形成しています。

シェア値だけを見れば、競合製品Aが最も市場内で優位性が高いと言えますが、果たしてそうでしょうか。

マトリクス分析の結果では、最もロイヤルカスタマー比率の低い競合製品Bが、ロイヤルカスタマーによる売上構成比が最も高く、安定市場を構築しています。

さらにc+d行における売上構成比が非常に低く、リソースを配分する必要がないため、競合との拮抗状況にあるI総合病院へ優先的にリソースを配分することが出来ます。

競合製品Bのロイヤルカスタマーの内訳は、県内唯一の大学病院です。

AbのI総合病院をAaにランクアップすればシェア1位となるため、現状の売上(シェア値)だけを見れば競合製品Aが市場内強者ですが、中長期的には競合製品Bが市場を占拠することが予想されます。

マトリクス分析法は、攻略すべき顧客を明確にし、競合他社との市場競争に競り勝つための、医薬品ビジネスに特化したデジタルソリューションです。

“Can Matrix Analysis Extract the True Target Customers? – A Focus on Pharmaceutical Marketing”

Can Matrix Analysis Extract True Target Customers?

Marketing automation, a digital resource aimed at streamlining mass marketing to potential customers, can identify high-probability buyers and enhance acquisition rates through sales efforts.

However, in the realm of medical pharmaceutical marketing, which requires physician-prescribed medications, a precise 1-on-1 approach to target customers is essential.

This raises concerns that digital marketing automation might miss crucial customers with limited online access.

Therefore, it’s imperative not only to target customers with a clear intention for prescription but also to encourage those with lower prescription intent to take action.

Let’s examine whether Matrix Analysis, backed by patented dummy data, can extract true target customers.

In this market, three major players dominate: Product A with a 28% share, our own product with 25%, and Product B with 24%.

Although Product A seems most dominant based solely on market share, is that truly the case?

Matrix Analysis reveals that Product B, with the lowest ratio of loyal customers, boasts the highest revenue contribution from these customers, securing a stable market position.

Moreover, the revenue contribution in rows c+d is minimal, indicating no need for resource allocation, allowing us to prioritize allocating resources to Hospital I, a major player in tight competition with competitors.

Loyal customers for Product B are exclusively found in the only university hospital in the county.

By elevating Hospital I to Aa, we can secure the top position and, while Product A holds the immediate market share lead, in the medium to long term, Product B is projected to dominate the market.

Matrix Analysis serves as a specialized digital solution for the pharmaceutical business, clarifying the customers to target and equipping us to outperform competitors in the market battle.

現状のリソース量を定量化出来ているでしょうか?

KPIにより定量化はされていても適切なリソース量であるかは分からない方もいると思います。

では、適切なリソース量とはどのように決めるべきでしょうか?

それは目的によって異なります。

口座開設、処方の開始など様々な目的がありますが、最終的な目的は、自社製品のロイヤルカスタマーへの育成のはずです。

ロイヤルカスタマーとは他社製品へスイッチのリスクがない顧客です。

競合を意識した場合のリソース量は、競合のリソース量に対して相対的に決まります。

戦力量分析(特許出願中)の結果から、現状の1.2倍のリソース量が必要だとします。

1.2倍のリソース量を算出するためには、現状のリソース量を定量化する必要があります。

項目ごとに、回数とインパクトを係数として戦力量を算出してみましたがいかがでしょうか?

上司同行の効果が期待出来ない場合には、係数を下げる必要がありますよ。

“Quantifying the Appropriate Amount of Resources”

Can you quantify the current Amount of resources accurately?

While quantification through KPIs might be in place, there are still individuals unsure if the resources allocated are appropriate.

So, how should one determine the right Amount of resources?

This determination depends on the objective at hand.

Whether it’s opening accounts or initiating prescriptions, there are various purposes, but the ultimate goal should be nurturing loyal customers for your company’s products.

A loyal customer is one who presents minimal risk of switching to competitors’ products.

When considering competition, the allocation of resources is relative to the resources of the competition.

Based on the results of the Force Strength Analysis (patent pending), it is assumed that 1.2 times the current resources are required.

To calculate this 1.2 times resource allocation, it’s necessary to quantify the existing resources.

An attempt has been made to calculate force strength for each item, frequency and impact coefficients. How does this approach resonate?

Remember, if the effect of supervisor accompaniment is not promising, there might be a need to reduce the coefficients.

人々の知識や経験、文化などによって、定性情報の解釈が異なるため、完全に共通の認識を得ることはとても難しいことです。

  1. 抽象的な概念や感情である定性情報では、認識のズレが生じ、受け手が情報を適切に理解することが出来ない
  2. 情報を受ける側が自身の経験や感情に基づいて解釈するため、本来の意図とは異なる認識している
  3. 共通の知識や経験が異なることから、受け手が情報を自分のコンテキストに結びつけられない
  4. 相手が具体的な事例やデータを求めた場合、それを提供できないことからコミュニケーションが途切れる

定性情報だけで共通の認識を持つには、いくつかのポイントがあります。

  1. 共通の言葉や文脈を確保する
  2. 共通の類似した経験や視点を共有する
  3. 具体的な例を提供する
  4. オープンで率直な対話により理解を深める

さらに共通の理解を高めるためには、定量情報を用いることが非常に大切です。

定量情報は定性情報だけでは伝えにくい情報や観点を補完し、より具体的で客観的な視点を提供する役割を果たします。

  1. 数値化により、異なる要素や項目を明確に比較することが可能
  2. 数値の変化や傾向から動向を把握し、予測することが可能
  3. 客観的で信頼性のある情報を伝えることが可能

定量情報は定性情報を補完し、ビジネス上の意思決定を裏付けることが出来ます。

属人的な側面が強い営業担当者同士のコミュニケーションに定量情報は絶対に有った方がいいです。

定性情報だけの会議は空中戦を繰り広げるさながらドッグファイトです。