医療における経済合理性や統計的な平均値は、副作用などの被害に遭った個人の固有な人生を軽視してしまう危うさを含んでいます。全体の利益と個人の損失を天秤にかける「トレードオフ」の論理だけでは、取り残された当事者が抱える「なぜ自分はその他なのか」という問いに答えられません。この課題を解決するため、出来事を偶然や物語で片付けるのではなく、因果関係を科学的に解明する「因果推論」が求められています。弊社が開発するAI分析モジュールを通じて、医療の意思決定に客観的な根拠と再現性をもたらし、個人が納得できる説明責任を果たす社会を目指しています。
AIで創薬標的を探す動きが加速しています。オミクス、EHR/RWD、論文知識グラフ、ネットワーク解析――データが揃い、計算資源も潤沢になり、「相関が強いもの=有望な標的」という発想は、ますます魅力的に見えます。
しかし、ここに大きな落とし穴があります。相関は“候補を拾う”ことはできても、“叩けば治る”を保証しないのです。創薬の意思決定に必要なのは、結局のところ「介入したらアウトカムが動くか」という因果です。相関のランキングをどれだけ精緻化しても、因果の問いに答えなければ、成功確率は上がりません。
*ミュートしています
相関AIが生みやすい“見せかけの標的”
相関は、病態の本体ではなく、病態に付随する「温度計」を上位に押し上げがちです。典型例は次の4つです。
- 逆因果:病気の結果として変化している(原因ではない)
- 交絡:年齢、重症度、治療、炎症などが両方を動かしている
- 選択バイアス:データに入っている人・測れている人が偏っている
- 代理マーカー問題:叩いても治らないが、病気の“指標”としてはよく動く
つまり、相関AIが得意なのは「疾患らしさの検出」であり、「治療可能性の検証」ではありません。ここを混同すると、探索段階のスピードは上がる一方で、後工程(検証・PoC)で失速します。
提言:AI創薬は「相関→因果」へ設計を切り替える
ではどうするべきか。ポイントは、相関を否定するのではなく、相関を“入口”として使い、因果の証拠へ計画的に接続することです。私は、次の3点を提言します。
1) まず「因果質問」を一文で固定する
「Xを増減させたら、Y(臨床的アウトカム)は変わるのか?」
この“介入形”の問いを最初に固定しない限り、AIは相関の沼に戻ります。議論も評価もぶれます。
2) DAGで“調整すべきもの/触ってはいけないもの”を明文化する
創薬のデータ解析は、説明変数が多く、恣意性が入りやすい領域です。DAGは、交絡・媒介・コライダーを整理し、**「何を調整し、何を調整しないか」**を合意形成する道具になります。これがないと、同じデータから都合の良い結論が量産されます。
3) 「因果の証拠の階段」を用意して、早い段階で反証する
因果は一発で証明するものではありません。だからこそ、段階設計が重要です。例えば、
- 縦断データで時間順序を確認する(逆因果を潰す)
- 遺伝学的自然実験で方向性を補強する(完全ではないが強い補助線)
- 摂動実験(CRISPR、プローブ、オルガノイド等)で介入の手応えを取る
- 負の対照・感度分析・外部データで“たまたま”を落とす
成功のコツは、**「当てにいく」より「早く外す」**です。相関で候補を増やすより、因果でハズレを早期に消す方が、最終的な成功確率は上がります。
まとめ:相関は加速装置、因果は成功確率を上げるエンジン
AIが相関探索を高速化したのは事実です。しかし、創薬は「見つける競争」ではなく「当てる競争」です。**相関で候補を拾い、因果で標的を確定する。**この流れを設計に組み込み、評価指標も「相関の強さ」から「因果の確からしさ(反証への強さ)」に移すべきです。
相関の時代は終わりません。ただ、相関のままでは勝てません。
AI創薬の次の主戦場は、“相関から因果への変換プロセス”そのものです。
統計の世界にも、量子コンピュータに相当する発想の転換が起きつつあります。それが分布構造分析(DSA)です。
従来の統計学は、母集団が正規分布に従うという前提の上で、平均値や有意差を求めることで現象を理解してきました。これは、0と1のビットの積み重ねで世界を記述する古典コンピュータに似ています。すなわち「平均」という単一軸の上で現象を整列させ、逸脱する値はノイズとして扱う——そのような世界観です。
しかし実際のデータは、単一の正規分布では説明できない複雑な構造を持ちます。市場シェア、SNSフォロワー数、疾患の重症度分布、どれをとっても、上位少数が大半を占める「べき乗分布」や、多峰性をもつ「混合分布」など、非線形で非対称な構造を示します。ここに光を当てるのがDSAです。
DSAはデータを降順に並べ、AICやBICなど情報量基準に基づいて複数の分布モデルを比較し、最も自然な構造を選び出します。重要なのは、確率的な「偶然性」ではなく、構造的な「必然性」を見いだす点です。これは量子コンピュータが確率振幅の重ね合わせを利用して、最適状態を探索する原理ときわめて似ています。
古典的統計が「平均的現象」を捉える道具だとすれば、DSAは「構造的真実」を暴く顕微鏡です。外れ値やマイノリティを切り捨てるのではなく、それらを含めた全体構造を可視化する。すなわち、統計を量子化する発想の転換——それがDSAです。
🔹1. 計算の「前提」と「構造の捉え方」の違い
- 従来の統計手法は、正規分布を前提に「平均的な傾向」や「有意差」を求める線形的・決定論的アプローチです。
→ 古典コンピュータが0/1のビットで線形的に演算を積み重ねるのと似ています。 - DSAは、データの分布構造そのもの(指数分布、対数正規分布、ベキ分布など)を探索し、そこに潜む「構造的多様性」や「非線形関係」を明らかにする構造論的・確率振幅的アプローチです。
→ 量子コンピュータが複数の状態(重ね合わせ)を同時に扱うように、DSAもデータの多様な分布状態を同時に評価します。
🔹2. 対象とする「現象の次元」
- 従来統計は「平均値」や「分散」など一次統計量中心で、外れ値や非線形性はノイズとみなす傾向があります。
- DSAはむしろ外れ値や極端な偏りを「構造的特異点(singularity)」として重視します。
→ 量子コンピュータが“異なる経路干渉”を情報源とするように、DSAも“異なる分布形の干渉”から新たな洞察を導きます。
🔹3. 解の「確率」から「構造」への転換
- 従来統計のp値は、「偶然で起こる確率の低さ」を示すにすぎず、構造的な必然性は説明できません。
- DSAは、AIC/BICに基づいて複数の分布モデルを比較し、構造として最も自然な形=必然的秩序を定量化します。
→ 量子コンピュータが確率振幅の干渉から「最も安定した状態」を見つけるのと同様です。
🔹4. 世界観の違い

🔹5. 結論:パラダイムシフトとしてのDSA
従来の統計が「確率の枠内で真偽を問う」ものだとすれば、
DSAは「構造の中で意味を問う」ものです。
つまり、DSAは“統計の量子化”ともいえる構造的パラダイムシフトであり、
確率論的世界観から構造論的世界観への転換を象徴しています。
自民党との長年の連立を離脱した公明党がネットを中心に、その決断が大きな誤算であったと盛り上がっています。その決断が正しいのか誤りなのか、DSA(分布構造分析)で検証してみました。結論的には、その判断は感情論ではなく、構造的に極めて合理的な決断と言えそうです。
分布構造分析(DSA)の結果から見えてきたのは、公明党が小規模政党でありながら、現在の分散化した政治環境において最も高い構造的中心性を持つ中核プレイヤーであるという事実です。つまり、固定的な連立にとどまるよりも、自立した立場で柔軟に動くほうが影響力を高められる構造条件が成立していました。
1. データから見た現在の政治構造
2025年時点の衆参両院を合わせた議席総数は 713(衆465+参248) です。
公明党は衆議院で 24議席(5.2%)、参議院で 21議席(8.5%)、合計 45議席(6.3%) を保有しています。自民党(318議席、44.6%)や立憲民主党(186議席、26.1%)に次ぐ中規模政党であり、単独では過半数を握れませんが、どの政権構成においても欠かせない“閾値プレイヤー”として存在しています。
DSAによる議席分布の解析では、政治構造が「べき分布型(寡占)」から「分散型」へ移行していることが分かりました。累積分布関数に基づくスロープ係数(α値)は –1.23 → –0.88 へと緩和し、一強構造が崩れ、複数の中規模勢力が並立する多極構造が形成されています。この転換点では、最大規模の政党よりも複数勢力をつなぐ中間ノードが最も高い影響力を発揮します。
2. 公明党の構造的位置(DSA指標)
DSAでは、政党間の関係を「構造中心性(C)」という数値で表します。これは、どの政党が“過半数を形成できる最小の連立パターン”にどれほど頻繁に登場するかを示す指標です。
この結果から、公明党は小規模ながらも連立形成において最も頻繁に出現する「ブローカーノード」に位置しています。つまり、政権の安定と変化の両方をつなぐ“ハブ”として機能しているのです。

3. DSAによる合理性の裏付け
DSAでは、議席規模に対する影響力の効率をE = C / S(影響効率)として算出します。
Eが大きいほど、議席シェアに比して影響力が高いことを意味します。
- 自民党:E = 0.92 / 0.446 = 2.06
- 立憲民主党:E = 0.74 / 0.261 = 2.83
- 公明党:E = 0.66 / 0.063 = 10.48
公明党の影響効率は、主要三党を大きく上回っています。この結果は、議席数の小ささを“構造的な位置の強さ”で補い、むしろ優位に立っていることを示しています。したがって、連立離脱により交渉範囲を広げる判断は、データ構造上の最適行動といえます。
4. 「構造的自立」とは何か
ここで言う「自立」とは、どの政党とも協調しない「孤立」を意味するのではありません。むしろ、DSA的には以下の3つの形態があり、そのうち最も合理的なのが「戦略的自立(ブローカー型)」です。
つまり、公明党にとっての「自立」とは、どの党とも距離を保ちながら、政策単位で柔軟に連携できる状態を意味します。固定連立よりも柔軟で、孤立よりも接続的。これこそが「構造的自立」です。

5. 国民から見た存在意義と影響力
政党は最終的に国民から選ばれる存在です。公明党が単独で政権を担う可能性は低くとも、政権構造を左右する「選定者」としての影響は無視できません。
DSA上の高中心性(C=0.66)は、政党間ネットワークにおける影響の強さを示しますが、実際にはこれが政策形成力・法案成立率・政権安定度といった形で国民生活に影響します。つまり、公明党は「数」ではなく「構造的役割」によって、結果的に国民の選択に作用している政党だと言えます。
6. データが示す合理的離脱
以上の分析を総合すると、公明党の連立離脱は感情的決断ではなく、分散化した政治環境における構造的最適化行動です。規模に頼らず、構造上の位置によって影響力を最大化する。それがDSAの示す「戦略的自立」の姿です。
公明党がどこまで確信を持って、今回の決断に至ったかは知る由もありませんが、数の論理を超えて、構造の論理での行動は、まさに、DSAが描き出す“見えない合理性”を体現した結果だったと言えるでしょう。
7. 現実的な結論
公明党は、「構造的中立優位(Structural Neutral Advantage)」であるがゆえに、全方向へのレバレッジが働く構造的優位ですが、現実的には、DSAの分析上でも、そして政治現実の上でも、公明党が単独で持続的に政策影響を及ぼすことは構造的に困難です。
つまり、「共闘・連立」は必須条件ではあるが、それを戦略的・選択的に行うことこそが影響最大化の鍵です。ただし、ここで重要なのは、「誰と組むか」ではなく「どう組むか」です。この中立性が公明党の強みであり、固定連立を超える柔軟戦略を支えています。

パターンやトレンドによる従来の統計手法は、時間軸上に2点以上のデータ(過去→現在→未来)を前提に、変化の傾向や線形外挿によって将来を推定します。これに対して、分布構造分析「時間変化」ではなく、「構造そのものの安定性と偏差」を解析対象とするため、1時点のデータのみで予測が可能です。
1. データの分布構造を特定する
- AIC/BICなどの情報量基準を用いて、対象データがどの分布構造に従っているかを統計的に判定します。
- これにより、「どのような構造的バランスで力が分布しているか」を数理的に把握できます。
(例:議員票・党員票・県連票がどの程度の偏りをもって分布しているか)
2. 理論値(構造的平衡点)を算出する
- 推定した分布パラメータ(例:平均値μ、分散σ、形状係数αなど)から、理論上の平衡値(構造的に安定する得票バランス)を導出します。
- この理論値と実測値との差(偏差)を「構造的ポジション」として定量化します。
3. 偏差の方向と強度から“次に起こる修正”を予測する
- 分布構造には、外力が加わらない限り安定方向へ修正されるという統計的性質があります。
- したがって、どの候補が理論的均衡点を上回っているか/下回っているかを分析することで、次の投票行動(再分配の方向)を推定できます。
■ 今回の総裁選における適用例
1回目投票では、
- 高市早苗氏 は議員票で理論構造を上回り、組織的な支持基盤において優位な位置にありました。さらに、党員票でも他候補を上回り、いわば民意の支持を最も強く取り込んだ候補でした。理論的には、組織と民意の両輪が安定方向に収束する構造を示しており、これは決選投票で有利に働くと予測されました。
- 小泉進次郎氏 は議員票で理論構造に近い安定的な位置にありましたが、党員票とのバランスにわずかな歪みが見られました。構造的にみると、支持が特定層に集中しやすい形で、広がりよりも尖りが強いタイプの分布といえます。
このように、1回目投票時点での「構造のバランス」から見て、議員票と党員票がともに安定方向に近い高市氏が、決選投票で票の再配分を受けやすい構造にあったと分析されます。
すなわち、時間の経過ではなく「構造の整合性」によって勝敗の方向性が定まったと考えられます。
■ 構造的分析と従来手法の決定的な違い
| 項目 | 従来のトレンド・回帰分析 | 分布構造分析 |
| 前提 | 時系列の2点以上 | 単一時点で可 |
| 観点 | 変化量(Δ) | 構造(Σと偏差) |
| モデル | 線形または非線形の関数近似 | 分布形状(指数・対数・ベキ乗など) |
| 予測根拠 | 時間方向の傾き | 構造安定化の方向性 |
| 解釈 | 「過去の延長」 | 「構造の是正(均衡化)」 |
■ 要約
単なる票の増減や相関ではなく、得票分布がどのような形状(分布構造)を持つかを特定し、その理論分布からの偏差を解析します。今回の分析では、議員票はベータ分布(安定構造)、党員票はワイブル分布(脆弱構造)に従うことが判明しました。
議員票は有限範囲内で両端に集中しやすい構造を持ち、理論値との乖離(RPI=0.174)は小さく安定的です。特に高市氏は議員票で理論値を+24.2%上回り、構造的に優位なポジションにありました。一方、小泉氏の議員票は理論値にほぼ一致(−0.9%)しており、議員票構造の「中軸」に位置していたといえます。
一方で、党員票は理論値との乖離(RPI=0.890)が極めて大きく、構造的脆弱性を示しました。ワイブル分布が想定する極端な集中(数千票規模)は実際には起きず、高市・小泉両氏とも理論上「大幅不足」と算出されました。これは党員票の実態が、理論分布よりも穏やかで安定していたことを意味します。
分布構造分析の特徴は、時間軸を必要とせず、1時点のデータから構造の歪みと修正方向を予測できる点にあります。今回の構造分析では、党員票(民意)の不確実性を内包したシステムが、最終的に議員票(組織構造)の安定解に収束すると予測していました。つまり、決選投票での高市氏の勝利は「トレンド」ではなく「構造安定化の帰結」だったのです。
政治は民意の上に成り立ちますが、民意の波動を安定化させるのは構造の力です。分布構造分析はその“見えざる構造”を可視化し、なぜ結果がそうなったのかを説明する新しい分析手法と言えます。
構造分析は、時間的データが乏しい政治選挙や突発的事象においても、「いま、この瞬間の構造の歪み」を捉えることで、「次にどの方向へ是正が起こるか」を予測できる手法です。
今回の自民党総裁選で高市早苗氏が決選投票で選ばれたことは、単なる勢いやトレンドではなく、分布構造が最も安定する方向への帰結であり、まさに構造分析が導いた“構造的予測”の実証例といえます。
テレビや新聞を“オールメディア化”させた要因は何でしょうか?インターネットの存在は確かに大きな背景です。しかし、決定的だったのは スマートフォンの普及 でしょう。
インターネットだけでは不十分だった理由
インターネットはPC時代から存在していましたが、当時は利用者が限られており、利用時間や場所も制約がありました。そのためテレビや新聞を「常に持ち歩くメディア」として置き換えるには至りませんでした。
スマートフォンがもたらした変化
- 普及率の高さ:日本では成人の98%がスマホを所有しているとされ、テレビや新聞以上にリーチ力を持つメディアとなりました。
- 常時接続:場所や時間を選ばず、手のひらからインターネットにアクセスできる。
- マルチメディア統合:動画(テレビ)、ニュース(新聞)、SNS(口コミ)、EC(商取引)まで、すべてを一台で完結できる。
- 即時性と双方向性:受動的なテレビ・新聞と異なり、能動的に情報を検索・発信し、同時に共有できる。
結果としての「オールメディア化」
スマホは、テレビ・新聞・雑誌・ラジオといった既存メディアを 一つの端末に吸収し、常に持ち歩ける状態 にしました。これが「オールメディア」という概念の現実化であり、媒体の境界線を曖昧にした最大の要因です。
自民総裁選で賑わってますが、ステマ問題など、デジタルチャネルの選択は非常に重要です。総裁選の盛り上がりは、単なる政治イベントにとどまらず、 情報発信におけるチャネル戦略の縮図 とも言えます。企業が新製品を売り出す時と同じように、政治家も「どの媒体で」「誰に」「どんなストーリーで」伝えるかが勝敗を分けそうです。
相関関係と因果関係の違い
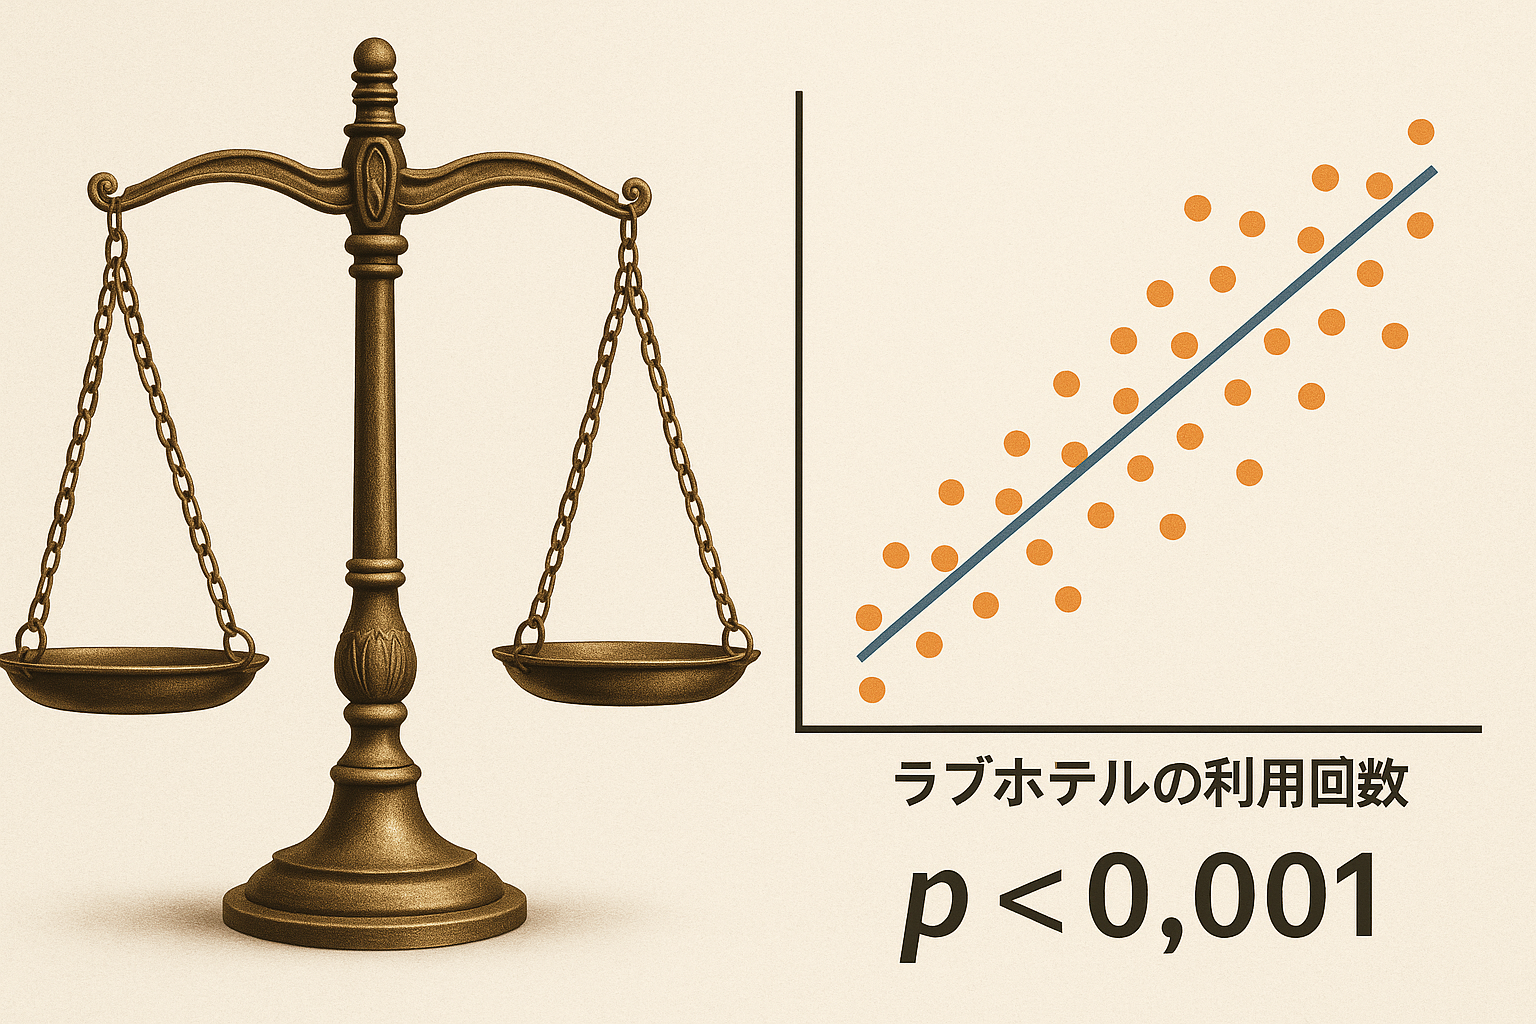
前橋市長(女性42歳独身)が部下の既婚男性の10回にのぼり、ラブホテルで密会を続けていた件がニュースを騒がせています。市長は男女の関係を否定していますが、一方で民事ではラブホテルの利用は不貞行為があったと認定される事象です。
ビジネスの世界でも「AとBが一緒に起きている」ことはよくあります。これが相関関係です。しかし相関は因果を意味しません。たとえば「売上増と広告費増」には強い相関がありますが、「広告費が売上を増やした」のか「売上が伸びて広告費に回せた」のかは別問題です。
今回の事例でいえば、「ラブホテルに10回行った」という事実と「不貞関係があった」という解釈には強い相関がありますが、それが因果かどうかは別次元の議論です。
p値で考える「偶然の説明可能性」
統計学で使うp値は、「もし因果がないとしたら、このようなデータが偶然出る確率はどのくらいか」を表します。
- 帰無仮説(H0):不貞はない
- 観測事象:同じ相手とラブホテルに10回以上入る
この場合、H0のもとで10回のホテル利用を説明できる確率は極めて低いと考えられます。p値はほぼゼロに近づき、「偶然では説明できない」と解釈されやすい。だからこそ裁判所は「社会通念上、不貞を推認できる」と判断するわけです。
第一種過誤と第二種過誤
ここで重要なのは誤判定リスクです。
- 第一種過誤(α):本当は不貞がないのに「ある」と誤認(冤罪型)
- 第二種過誤(β):本当は不貞があるのに「ない」と見逃し(見逃し型)
民事裁判では「優越的蓋然性(もっともらしさが50%超)」が基準です。刑事の「合理的疑いを超える確信」ほど厳しくはありません。つまり、第二種過誤をできるだけ避ける方向にバランスをとっているのです。
ビジネスへの示唆
今回の事例はスキャンダルですが、統計的思考はビジネス判断にも通じます。
- 相関と因果を混同しない
- p値は「真実の確率」ではなく「偶然説明のしにくさ」
- 誤判定リスク(第一種・第二種過誤)を意識して意思決定する
マーケティング施策や新規事業の成否判断も同じ構造です。「偶然の成功」か「再現可能な因果」かを見極めることが、戦略的な強みを生むのです。
企業経営において、「利益を出すこと」は経済的合理性や株主価値の観点から当然の要請です。利益は純資産を増加させ、株価を上昇させ、企業価値を高めます。資本市場では「儲かっている会社」が評価される。これは紛れもない事実です。
しかし、これは市場が成長していることが前提の話。現在のように人口減少や経済の停滞により、市場が構造的に縮小している局面では、話は大きく変わります。
売上=シェアという視点が求められる
市場が縮小するということは、「パイが小さくなっていく」ということです。全体の成長が見込めない状況では、企業が売上を維持・拡大するためには、競合からシェアを奪うしかありません。
このようなゼロサムゲームでは、「利益率」よりも「売上=市場シェア」の方が、将来の生存可能性を左右する重要な指標となります。
すなわち、利益率を犠牲にしてでも売上を取りに行く戦略が、長期的に合理的なのです。
戦力量を削って利益を守る愚
ところが、昨今よく見られるのが「利益率を維持するための人員削減」です。これは一見すると効率的で財務的に健全な判断に見えますが、戦力量の低下=営業力・提案力・顧客接点の減少を意味し、やがて売上の減少を招きます。
特に、営業現場の人員削減はエリア放棄や顧客喪失に直結しやすく、市場シェアを明け渡す結果となりかねません。
縮小市場では逆効果の戦略
市場が伸びている時期であれば、「利益率向上のための合理化」は通用します。しかし、縮小市場では逆です。
人員削減で戦力を削ぎ、売上が減少し、シェアを失えば、企業の競争力そのものが揺らぎます。つまり、「利益率向上のための人員削減」は、短期的には数字が良く見えても、長期的には衰退に向かうリスクが極めて高いのです。
生き残る企業の条件
いま求められているのは、「利益の最大化」ではなく、「戦略的売上の最大化」。
そしてそれを実現するための「戦力量の最適配分」です。
- 利益率は結果であって、目的ではない
- 売上(シェア)は戦略的に確保しなければ、企業の土台が失われる
- 人員削減は最後の手段であり、競争力維持のための投資こそが必要
縮小市場では、あえて利益率を犠牲にしてでも、守るべきものがあるという視点が不可欠です。
DXS Stratify®が導く「勝つための戦略」
こうした市場縮小時代における戦略思考を支えるのが、DXS Stratify®です。
DXS Stratify®は、ランチェスターの法則に基づき、シェア値によって競争環境を可視化し、戦力量を定量的に評価することで、「どこで・誰と・どう戦うべきか」という意思決定を支援します。
さらに、人員削減を行う際にも、競争優位性を維持するために必要な最低限の戦力量を数値化し、適正なターゲティングとリソース配分を実現します。
単なるコストカットではなく、「勝ち残るための削減」かどうかを見極めるための、定量的な判断軸を提供するのです。
利益率よりも、シェアと戦力による競争優位性の獲得。
それを守るための意思決定ツールとして、DXS Stratify®は市場縮小時代の企業経営を支えます。
ランチェスター戦略はビジネスでも広く用いられていますが、「中小企業は一点突破」「弱者のための戦略」といった、あまりにも単純化された理解が独り歩きしているのも事実です。
たしかに、経営資源の限られた企業が勝つためには、闇雲に戦場を広げるのではなく、集中投下によって勝機を見出す「一点突破」の考え方は重要です。しかしこれは、あくまで状況に応じて導かれるべきであり、企業の規模や立場によって一律に決まるものではありません。
このような誤解が広がっている背景には、多くの人が「ランチェスター戦略」は知っていても、その根幹にある「ランチェスターの法則」を知らないことが一因と考えられます。
ランチェスターの法則とは、もともと第一次世界大戦時に開発された、戦力量の関係を数式で表現する数理モデルです。戦力差が戦局にどう影響するかを客観的かつ定量的に捉えるものであり、ビジネスに応用すれば、「市場シェア」「資源配分」「競争優位性」などをロジカルに判断する強力な武器となります。
一方、ランチェスター戦略とは、この法則を経営者向けに概念化・体系化したものです。「弱者は一点集中」「強者は広域制圧」といった原則は、あくまで“戦い方のパターン”を示すものであり、「強者は広く、弱者は狭く深く」といった表現に代表されるように、ランチェスター戦略はあくまで企業競争の原則を言語化したフレームワークのために、それをそのまま現代のビジネス環境における意思決定に用いるには解像度が不足しています。
とりわけ、競争が激化し、わずかな差が勝敗を分ける現代において、概念のような抽象的な戦略ではもはや通用しません。その判断には、数理的な裏付けが必要不可欠です。
「ランチェスターの法則」は、戦略を客観的・定量的にする数理モデルです。市場縮小期のゼロサムのゲーム型競争市場だからこそ、戦力量を数値化して競争優位性を築く必要があります。
ランチェスター戦略は「3分間英会話」、ランチェスターの法則は「英文法」
ランチェスター戦略とランチェスターの法則の関係性は、言語学習に例えると非常にわかりやすくなります。
たとえば「3分間英会話」は、すぐに使える表現を覚えて短期的な成果を得るための“入り口”です。それに対して、「英文法」は英語を本質的に理解し、応用力を持って使いこなすために必要な“土台”です。
これと同様に、ランチェスター戦略は、ビジネスの現場で「こう戦えばよい」と直感的に使える戦術的フレーム。
一方、ランチェスターの法則は、その戦略の根拠となる戦力差・効果比を数式で捉えた数理的な理論基盤です。
「中小企業は一点集中」「弱者は局地戦」といったランチェスター戦略の有名なフレーズも、法則に基づいて初めて意味を持ちます。
裏付けのない戦略は、実は“戦略”ではなく“願望”にすぎません。
だからこそ、本当に戦略を“使いこなす”には、感覚で語るだけでなく、ランチェスターの法則という“文法”から学び直すことが必要なんです。

