We are working on visualization to maximize the effectiveness of sales activities through sales support applications.
You can gain a competitive advantage by analyzing various data and visualizing it using digital technology.
Visualization makes it easier to grasp issues, and if the work flow is standardized, you can reduce costs by eliminating waste and reduce risks and mistakes.
Standardization creates a sense of unity in the organization and improves speed and quality without depending on individual skills.
let
Both “Mieruka” and “Kasika” mean making the invisible visible.
On the other hand, “visualization” means to make something visible, just like visualization, but it means to make something visible regardless of the person’s will.
Therefore, when arranging in the order that represents the state that is easier to recognize, it is “Mieruka” > “Kasika > “Sikakuka”
“What are the driving factors behind the pharmaceutical market? ”
We examined the correlation between the number of MRs, pharmaceutical market, and productivity in the pharmaceutical industry.
A significant correlation was found between the changes in the number of MRs and productivity.
However, there was little correlation between the changes in the number of MRs and the domestic pharmaceutical market.
On the other hand, there was a strong correlation between the fluctuations in national healthcare expenditure and the pharmaceutical market.
In other words, an increase in pharmaceutical sales leads to a rise in national healthcare expenditure, but the number of MRs does not seem to contribute significantly to the sales of pharmaceutical products. Considering these results, reducing the number of MRs to improve productivity appears to be a viable option.
“Verification of the Accuracy of Life Cycle Analysis”
I have examined the precision of life cycle analysis.
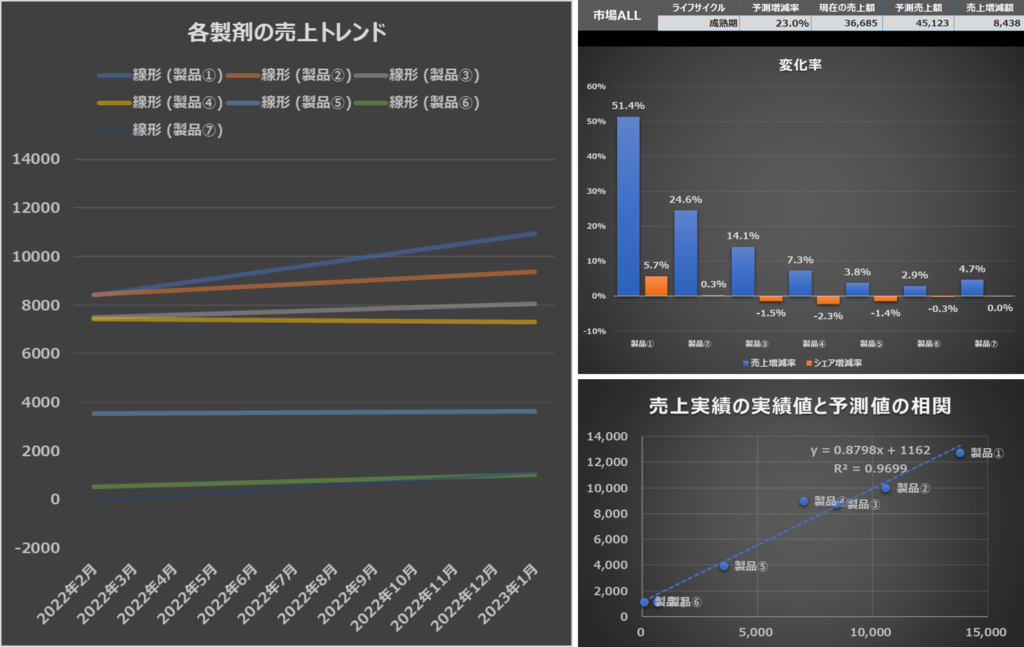
The inclination to the upper right direction increases in order from the top product. That is to say that indicating that products with higher sales (market share) tend to acquire a larger portion of the market.
Among the top 4 products, the trend of product 4 is flat, and the market share of product 3 is already expected to decline from the current 4 strong market of product 1, product 2, and product 3, so it is predicted that a two-strong competitive market will be formed in the future.
Products ⑤ and ⑥ exhibit a rising trend, albeit with lower absolute values, suggesting the potential success of a niche strategy.
In this situation, product ④ becomes the most vulnerable, as it becomes a likely target for attacks from competing products.
By calculating the market growth rate based on the total sales in April 2022 and January 2023, and plotting the scatter diagram between the highest sales figures for each product and the forecast values from the life cycle analysis, a very high correlation coefficient of 97% was observed.
Although the monthly evaluation of the market’s life cycle has a short timeframe, trends can still be discerned.
Furthermore, the high correlation with forecast values suggests that the current sales activities may not be having the desired impact.
“Still Active? The Challenges of Classic Business Planning”
Do you know when business frameworks like PEST analysis, 5 Forces analysis, 4C/4P analysis, and VC analysis were first proposed for external and internal environmental analysis in business planning?
PEST analysis, with its origins uncertain but dated back to the 1960s to 1970s, and 5 Forces analysis, introduced by Michael E. Porter in 1979, are well-known tools for external analysis. On the other hand, 4C/4P analysis was put forward by Edmond McCarthy in 1960, and VC analysis was presented by Michael E. Porter in 1985.
Furthermore, SWOT analysis was introduced by Henry Mintzberg in 1965, and STP analysis is attributed to Alfred Sloan during the 1970s to 1980s.
Isn’t it surprising? All of these business frameworks were proposed during the post-war period of high economic growth.
Instead of merely regarding these classic methods as historical knowledge, business schools and seminars continue to teach them as the standard approach to modern marketing planning.
However, I believe that using these business frameworks for marketing planning raises several issues:
These methods were developed during a period of market expansion, where demand outpaced supply. In contrast, the current market is facing stagnation and decline, posing a different set of challenges.
These subjective methods heavily rely on the experience and skills of the analyst, resulting in varying business plans with low reproducibility.
They lack affinity with data-driven marketing and digital marketing processes already established through big data analytics, marketing automation (MA), and sales force automation (SFA)/customer relationship management (CRM).
Among the numerous classic business frameworks, I find 3C analysis to be the most crucial.
This is because competitive markets inevitably involve rivals vying for the same market space.
The sales support application has four analysis methods and basic functions based on its own algorithm.
The only data required is pharmaceutical sales data.
STEP1: Decide KGI by life cycle analysis. I think that the sales target is determined by the head office, so it would be a good idea to set the market share value necessary to gain a competitive advantage.
STEP2: Once the KGI is decided, decide the STP that will be the guideline for resource allocation.
STEP3: Once resource allocation is determined by STP, decide KPIs that are specific quantitative indicators.
STEP4: Estimate the share value obtained when the KPI is executed as planned, and determine whether the KGI is feasible.
Through this series of cycles, you can create action plans that are specific, measurable, and feasible to gain competitive advantage. The results of these activities are reflected in the next month pharmaceutical sales data, so by tracking changes through matrix analysis, it is possible to quickly revise strategies in response to changes in external environmental factors, and gain a competitive edge in the competitive market.
“Processing pharmaceutical sales data will reveal the strategies of competitors.”
Major pharmaceutical companies are continuing to reduce the number of MRs.
Due to the reduction in the strength of the force, it should not be possible to allocate resources as before.
By using pharmaceutical sales data, it is possible to know where competitors are concentrating their management resources.
Pharmaceutical sales data is typically displayed as hospitals with 200+ beds or Brick.
Process pharmaceutical sales data and perform matrix analysis, such as classifying by segment such as university hospitals, core hospitals, key hospitals, and clinic, by purchase amount, and by number of patients, specialist doctors, and non-specialist doctors. This will show you a competitive strategy.
“Marketing automation leads to missed opportunities in the pharmaceutical business.”
In the medical pharmaceutical business, which requires prescriptions for using products, the marketing approach is a 1 on 1 targeting of exact customers. As a result, there is a mix of customers with high and low prescription intentions within the target audience.
In mass marketing targeting potential customers, one can efficiently extract high-conversion customers from the mix of customers with varying prescription intentions and conduct sales activities. However, this approach is not suitable for pharmaceutical marketing, where 1 on 1 marketing is prevalent.
Especially in the healthcare industry, where hierarchical structures based on medical office and personnel systems exist, it is essential to strategize how to approach influential customers.
Establishing accounts and nurturing high prescribing doctors at university hospitals and major medical facilities is a critical task in regional strategies, which is why companies deploy excellent sales representatives for this purpose.
Marketing through channels such as email and websites on the internet tends to attract customers who are more digitally savvy or have relatively more free time.
In labor-intensive medical settings, where sitting in front of a computer screen is limited due to a high number of patients, influential customers have less time for such activities.
As a result, marketing automation may end up extracting customers who are not the primary targets.
As a result, there is a loss of opportunity for customers who really need to be approached.
The pharmaceutical business requires specialized approaches.
“Marketing automation leads to missed opportunities in the pharmaceutical business.”
In the medical pharmaceutical business, which requires prescriptions for using products, the marketing approach is a 1 on 1 targeting of exact customers. As a result, there is a mix of customers with high and low prescription intentions within the target audience.
In mass marketing targeting potential customers, one can efficiently extract high-conversion customers from the mix of customers with varying prescription intentions and conduct sales activities. However, this approach is not suitable for pharmaceutical marketing, where 1 on 1 marketing is prevalent.
Especially in the healthcare industry, where hierarchical structures based on medical office and personnel systems exist, it is essential to strategize how to approach influential customers.
Establishing accounts and nurturing high prescribing doctors at university hospitals and major medical facilities is a critical task in regional strategies, which is why companies deploy excellent sales representatives for this purpose.
Marketing through channels such as email and websites on the internet tends to attract customers who are more digitally savvy or have relatively more free time.
In labor-intensive medical settings, where sitting in front of a computer screen is limited due to a high number of patients, influential customers have less time for such activities.
As a result, marketing automation may end up extracting customers who are not the primary targets.
As a result, there is a loss of opportunity for customers who really need to be approached.
The pharmaceutical business requires specialized approaches. In fact, it seem sales promotion by MR, MA by digital channels, and SFA/CRM are being implemented in parallel.
“What if the competitor’s strategy is the same as ours?”
There are various laws and regulations in the pharmaceutical business, and it will be the same strategy.
What happens when two competing companies adopt the same strategy is, first of all, increased competition.
Competitors adopting the same strategy nullifies product and service differentiation.
In addition, two companies adopting the same strategy will compete for customers and market share, and it will be a zero-sum game in which if one increases sales, the other decreases.
And in the end, the one with the most management resources will win.
So how can we avoid strategy duplication?
That is knowing competitor’s strategy.
It may seem obvious, but it is not easy to knouw or anticipate changes in a competitor’s strategy.
But the pharmaceutical industry has drug sales data.
This is extremely valuable data that covers the market/customers, competition, and the company’s 3Cs.
Because strategy is derived from 3C.
Pharmaceutical sales data is frequently updated, accurate, granular, and pre-quantified. By using pharmaceutical sales data, it is possible not only to take the initiative, but also to counterattack, or to avoid unnecessary competition and avoid a war of attrition.
“SFA/CRM improves the quantity and quality of sales activities to promote customer prescribing behavior”
SFA/CRM is a sales support digital tool that improves the quality and quantity of activities to promote customer prescription behavior.
SFA improves efficiency by visualizing the process and progress of sales activities.
CRM builds engagement from the analysis results of accumulated customer data and information.
In other words, it is a “means” to realize the “purpose” of promoting the prescribing behavior of customers.
However, it is not enough to have only the “purpose” to be achieved and the “means” to achieve it.
We need a “strategy” that is a guideline for realizing the “purpose”.
If you don’t have a clear direction, you’ll never get out of the loop of improving quantity and quality.
This is because if we continue to improve the means because we cannot obtain the expected impact on sales, the means will become the goal. Do you have a clear destination and a map to get there?
“How to determine resource allocation that drives customers to prescribe by SFA/CRM”
In the customer classification based on the so-called Pareto principle, which prioritizes customers with a large market size, In the same category, there is a mixture of the following customers:
① Our royal customers
② Competitors’ royal customers
③ Customers where our company and competitors are evenly matched
④ Customers with whom we have no transactions.
Therefore, even if the same marketing plan and the same KPI are executed for customers classified into the same category, whether or not it works depends on the ratio of customers who match the marketing plan.
In addition to the size of the market, it is necessary to multiply the four types of customer types.
A loyal customer is a customer who has no risk of switching from one’s own product to another company’s product.
On the other hand, it is difficult to turn a competitor’s loyal customer into a company’s own customer, and the amount of resources that greatly exceeds that of the competition is required.
The customers where our company and competitors are evenly matched should take priority over the competitors’ royal customers.
This type of customer is on the verge of winning or losing and cannot afford to be outdone by the competition, especially large market customers with a greater impact on the overall market.
Competing customers are therefore the customers on which resource allocation should be most concentrated.
The amount of resources required by competing customers is determined by the ratio of strength to the competition.
You can calculate the required amount of resources from the share value between the target competitor and your company.
In this way, after increasing the resolution of target customers, by improving efficiency and tracking with SFA/CRM, customers can be directed to prescribing behavior and be nurtured into loyal customers.