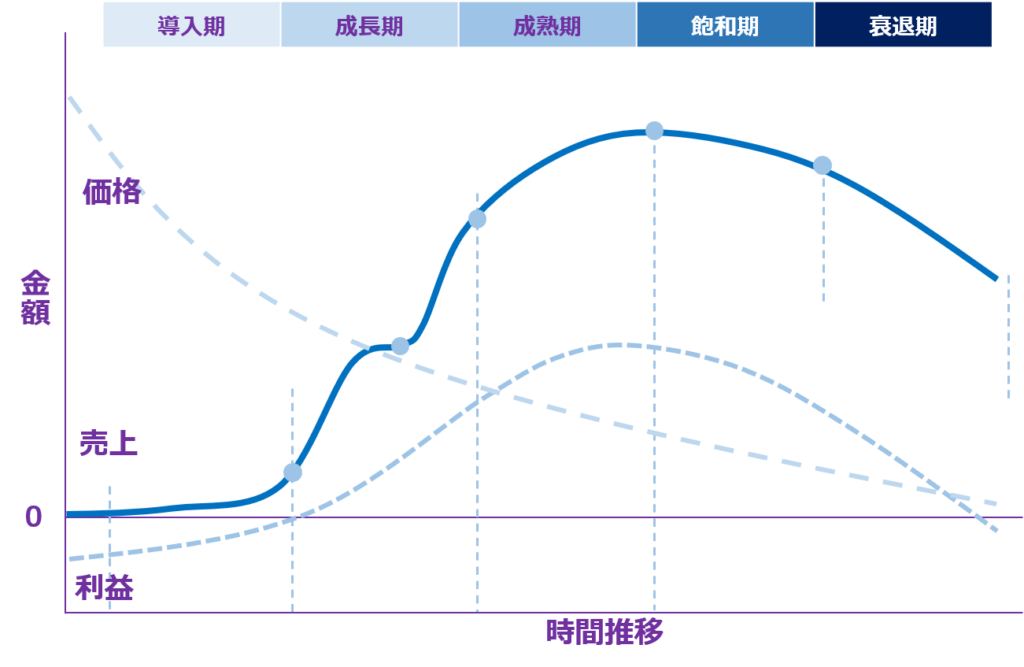
“Changes in Profits in the Pharmaceutical Product Life Cycle”
In the initial stage of market entry, where there are no sales, profits start in the negative due to upfront investments. However, profits increase as the market grows.
As the market matures, competition leads to price reductions, causing profits to decline again.
Therefore, profits tend to peak before reaching the peak of sales.
However, in the case of pharmaceuticals for medical use, where the official drug price is determined, price competition does not occur. Therefore, excluding the impact of price reassessment, the decrease in profits can be relatively gradual compared to other industries. Furthermore, from the customer’s point of view, the emergence of generic drugs means that the product life cycle will be longer than the life cycle for the developer.
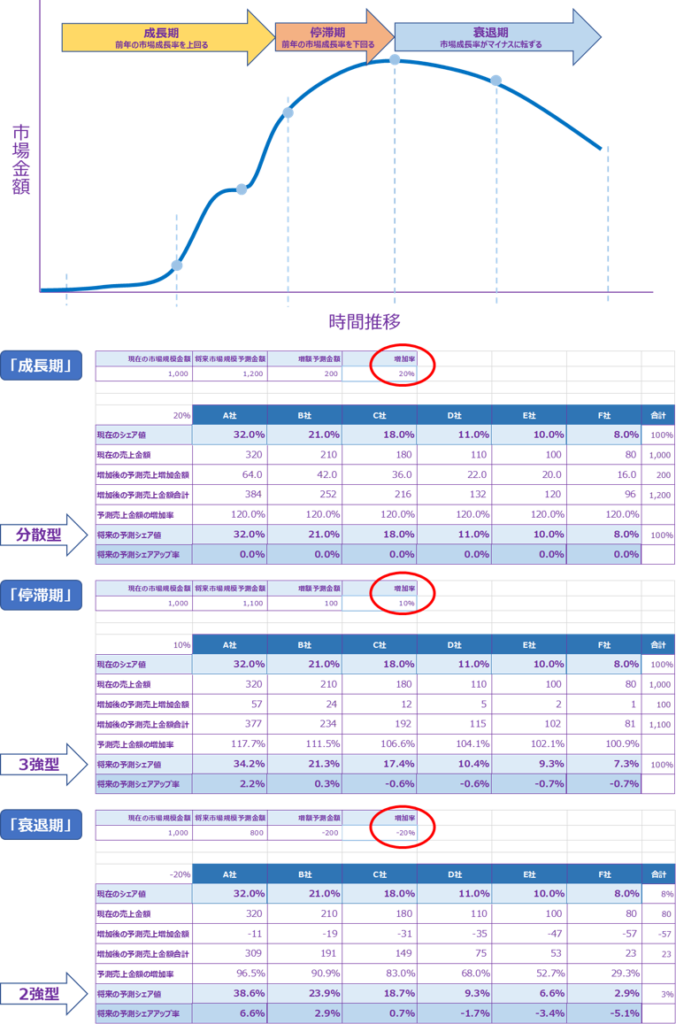
Sequel 2 “Even though sales are growing, we are actually losing to competitors” – Simulation of the transition of market growth phases and share types.
Using market share theory, I have simulated the transition of market growth phases and share types (the logic behind it remains undisclosed).
Based on the market growth rate, it is evident that the market share types shift from diversified to a three-strong or two-strong competitive market.
In the competitive environment, the outcome is already determined when sales decline, and making a comeback becomes nearly impossible.
Internal environmental factors are constantly influenced by the external environmental factors of the market/customers and competitors.
Therefore, tracking through the 3Cs (Customers, Competitors, and Company) is extremely important. Matrix analysis enables the quantification and visualization of competitive position and competitive advantage, thus facilitating tracking through the 3Cs.
Do you truly understand the importance of initial sales performance in entering a new market?
You may be aware of the significance of initial sales performance in entering a new market. But can you explain the reasons behind it accurately?
Simply achieving sales targets does not necessarily indicate a full understanding of its true meaning.
First and foremost, you need to gain recognition from customers.
To be recognized in the market, you need to capture at least a 3% market share.
Unless you have a blockbuster product, the products of new entrants in a normal market are usually fragile.
If the market is already dominated by strong players, the competitive landscape is shifting from a fragmented market to a “Big 3” or “Big 2” scenario, making it even more challenging.
The strategic principle here is niche strategy.
For a vulnerable new entrant to capture a 3% market share, it is crucial to secure a share in a market where there is no competition.
Segmentation, targeting, and positioning (STP) are essential prerequisites to ensure a reliable acquisition of a 3% market share.
Merely placing products without ensuring they are not returned the following month is equivalent to paying incentives to distributors for no real purpose. Even without existing sales data, matrix analysis can be applied to new market entry strategies.
Sequel “Even though sales are growing, you are actually losing to our competitors.”
While it varies depending on the industry and market, generally, in a mature market, the dominant players tend to acquire a higher proportion of the market share.
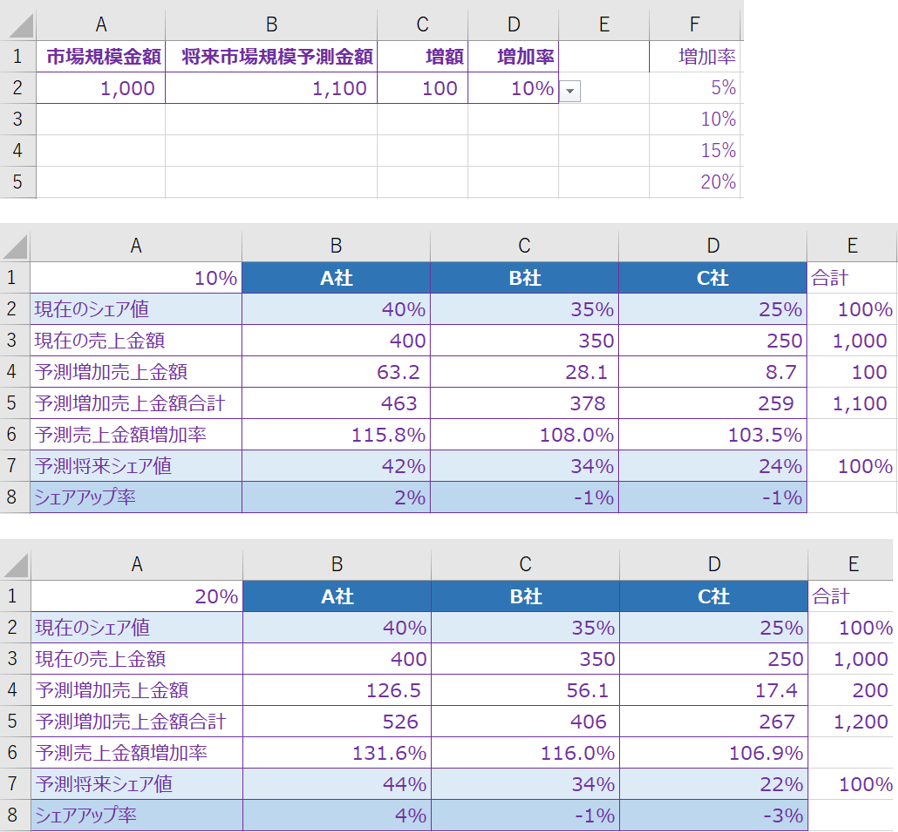
Using market share theory, I attempted to predict the changes in market share values accompanying the expansion of the market size (the logic behind this prediction is not disclosed).
During the growth phase, all products entering the market can increase their sales, resulting in an increase in the revenue of companies A, B, and C.
However, when looking at the market share, except for company A, both B and C have experienced a decrease in their market share values.
This implies a decline in their competitiveness.
The competitive environment is always influenced by external factors such as the market and customers’ factors related to competitors.
By utilizing order and delivery data, it is possible to analyze in conjunction with the matrix analysis method.
“Even though sales are growing, you are actually losing to our competitors.”
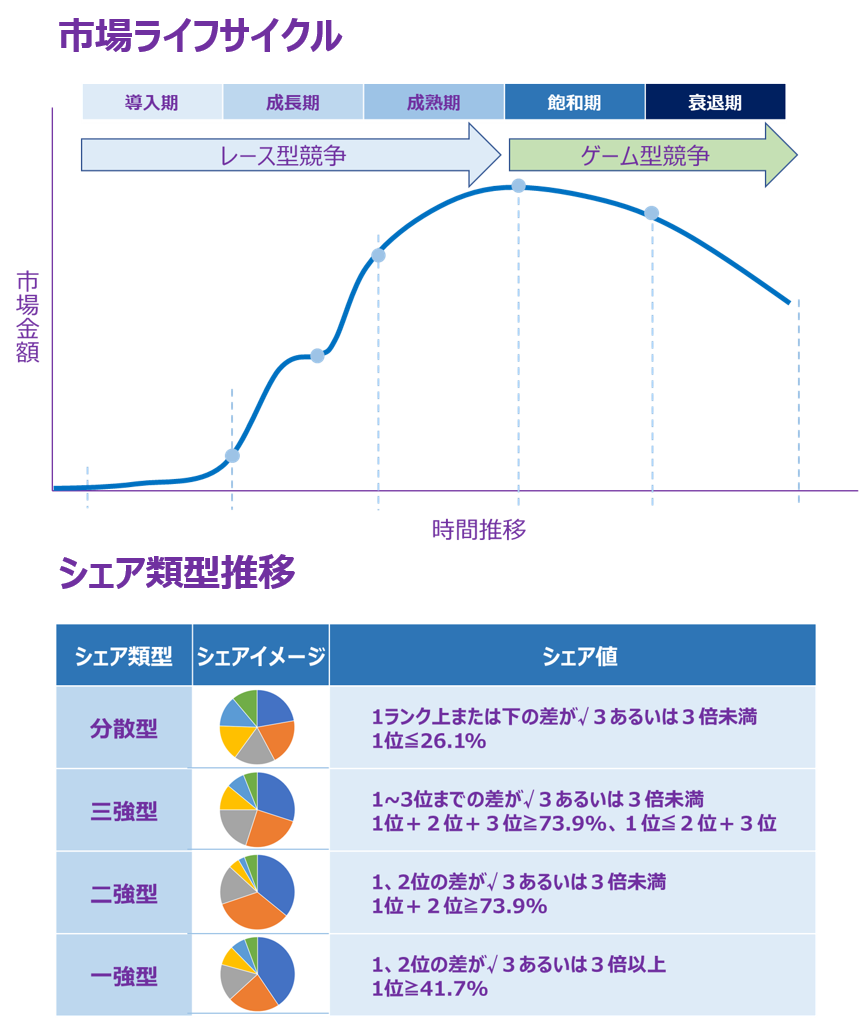
In the lifecycle of a market, the easiest period to increase sales is from the growth phase to the maturity phase.
During this period, all products entering the market have the potential to increase their sales.
While it may vary depending on the industry or market, generally, in a mature market, market leaders tend to acquire a large share.
In terms of the evolution of market share types, it is said that as the market lifecycle progresses, it transitions from a fragmented market to a three-strong market, then a two-strong market, and ultimately forms a one-strong competitive market.
The competitive environment is constantly influenced by external factors.
Without considering the impact of competitors, even if sales are growing, in reality, you may be losing to your competitors and have the potential to be eliminated from the competition in the near future.
Matrix analysis can quantify and visualize both external and internal environmental factors.
How far has the process of strategy/marketing planning been digitized?
In recent times, the digitization of the strategy/marketing planning process has been rapidly advancing. This includes data-driven marketing utilizing big data, extracting high-probability customers through marketing automation (MA), improving sales efficiency through sales force automation (SFA), and enhancing customer engagement through customer relationship management (CRM).
While some parts have not been fully replaced by digital means and still rely on human-driven aspects using business frameworks, if all processes can be digitized, it should enable flexible and agile decision-making in the unpredictable modern business environment. Using matrix analysis, the strategy/marketing planning process incorporates digitization to derive segmentation, targeting, and positioning (STP) by matrixing the competitive position and competitive advantage within the market based on external and internal environmental analysis using order and delivery data. This achieves a hierarchical structure in strategy/marketing planning processes involving data, analysis, execution plans, and tracking through digital transformation (DX).
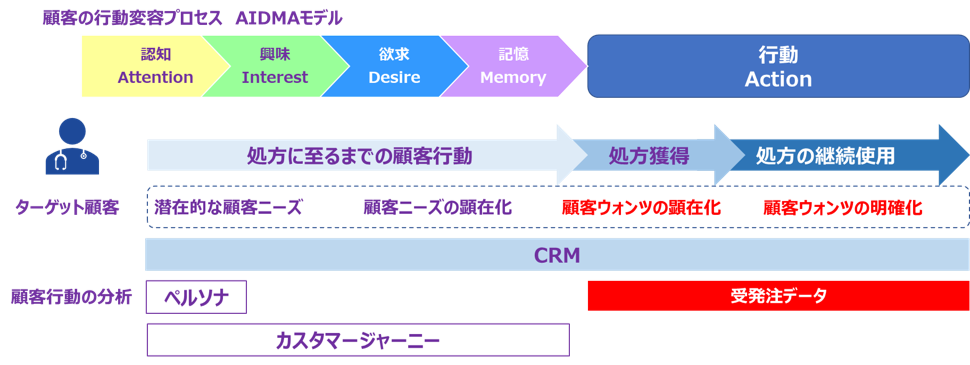
“AISAS + Comparison in the Customer Behavior Transformation Process”
Medical pharmaceuticals are a business model of product sales that relies on advanced information, creating an imperfect competitive market where companies with information have an advantage, exploiting information asymmetry.
The widespread use of the internet has brought significant changes to information transmission. The speed of information transfer has increased dramatically, enabling instant exchange of information.
Since the COVID-19 pandemic, the forms of communication have diversified, and online communication utilizing digital tools rapidly became popular, replacing the traditional offline methods conducted by medical representatives (MRs).
However, information transmission will eventually reach a saturation point, leading to an exhaustion battle where information becomes depleted.
In the customer behavior transformation process of the internet era, the AISAS model involves customers conducting their own information search. It is important to consider that competition always exists in the competitive market.
Therefore, among a wealth of information, customers not only explore their own company’s products but also easily access information about competing products, leading to comparative analysis.
Furthermore, nowadays, some individuals rely solely on word-of-mouth, considering only products that are widely regarded as good without conducting information comparisons.
In a game-like competitive market that is shrinking due to population decline and social security cost reduction, disclosing information too easily, forgetting the presence of competitors, and losing competitive advantage pose significant risks.
Matrix analysis allows for the quantification and visualization of the competitive position and competitive advantage based on the customers/market, competition, and the company’s 3Cs.
P&G (Procter & Gamble), a global consumer goods manufacturer, offers various products, and its business model is a textbook example of marketing. Therefore, many pharmaceutical companies also incorporate it as a role model in the medical pharmaceutical business.
So, does P&G’s business model work as a role model in the medical pharmaceutical business?
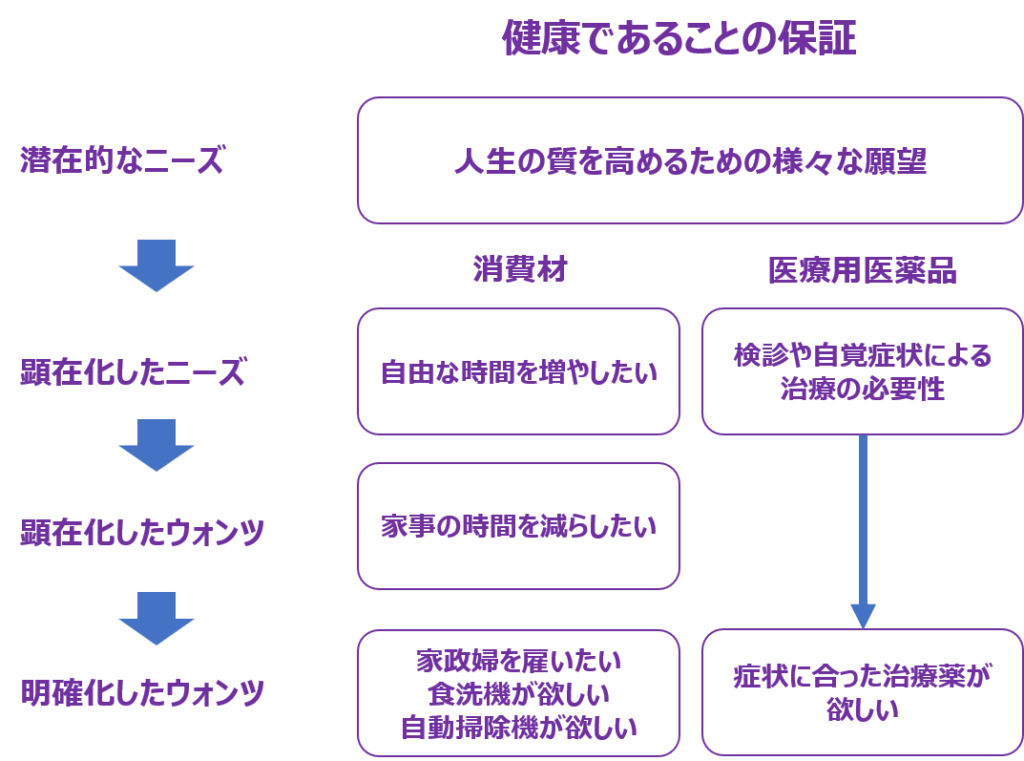
Consumer desires are generated from various wishes to improve the quality of life, assuming that they are healthy. Therefore, they are very vague and this is why “customers don’t really know what they want.”
Due to the ambiguity of desires, consumers continue to consume even if they are already materially satisfied but have insufficient mental satisfaction.
On the other hand, in the medical pharmaceutical business, while assuming that they are healthy, the wants are clear due to the manifested need for treatment.
If the illness is cured or the symptoms disappear, the desire is satisfied, and consumption behavior ends.
These are the reasons why I believe that a specialized business model is needed for the medical pharmaceutical business.
Matrix analysis quantifies and visualizes strategies based on order and receipt data, which are manifested pharmaceutical wants.
Health and life should be prioritized above all else, as without them, nothing else has meaning.
It is because people are healthy that they are able to lead good lives, focus on their work, and spend time with their family and friends.
Consumers and patients serve different purposes and support different business models in different contexts.
In particular, consumers have significant influence in the market, and their behavior can greatly impact companies and businesses.
To understand consumer needs and wants, a lot of information is necessary, and big data is incredibly useful for collecting and analyzing such information.
Since customer needs are often not consciously recognized by the customers themselves and are often implicit, needs and wants always contain ambiguity.
Therefore, big data analysis has become an indispensable tool for understanding consumer needs and wants based on behavior, preferences, trends, opinions, purchasing patterns, age, gender, location, and more.
On the other hand, patients must follow the treatment policies and prescription trends of medical professionals in order to receive appropriate care, and their influence on companies and businesses is limited compared to that of consumers. Matrix analysis enables the identification of physicians’ treatment policies and prescription trends from order and receipt data without the need for big data, making it possible to plan appropriate strategies.
When it comes to choosing consumer goods, customers’ tastes and preferences have a significant influence, so their needs and wants are diverse.
Therefore, companies need to collect big data such as product or service usage history, purchase history, access logs to social media and websites, etc. to accurately understand customers’ preferences and behavior patterns in order to better understand their needs and wants.
On the other hand, in selecting pharmaceuticals, factors such as patients’ conditions and health status, doctors’ diagnoses and treatment plans, and the efficacy and side effects of drugs are important considerations, so tastes and preferences are not directly related to the selection of pharmaceuticals.
Unlike consumer goods, patients need to receive appropriate information from doctors and choose effective and safe treatments.
Therefore, it is important for pharmaceutical companies to know the treatment policies and prescription trends of doctors so that they can provide the most appropriate treatment for patients.
The most reliable data for understanding doctors’ treatment policies and prescription trends is order and delivery data.
By looking at order and delivery data, companies can understand needs and know wants.
In the limited pharmaceutical business, the necessary data is also limited.
The challenge is how to effectively utilize that data. By using matrix analysis, it is possible to digitize everything from data analysis to execution plans.