早期退職などによりMRを削減した後の人員配置はどのように行えば良いでしょうか?

  1. 残った人員が全ての顧客をカバーする
  2. MRが不在になった顧客はターゲットから除外する
  3. 市場規模の大きな顧客から優先してリアロケーションする

もちろん正解は目的により異なります。

自社製品の情報を提供することが目的であれば、これまでMRが訪問し情報提供を行っていた全ての顧客には、残った人員が従来通り訪問しなければなりません。

しかし、現在の売上高を維持し、さらに売上を向上させるのであれば、1~3の中には正解はありません。

現在の売上高を維持し、さらに売上を向上させるために必要なこと
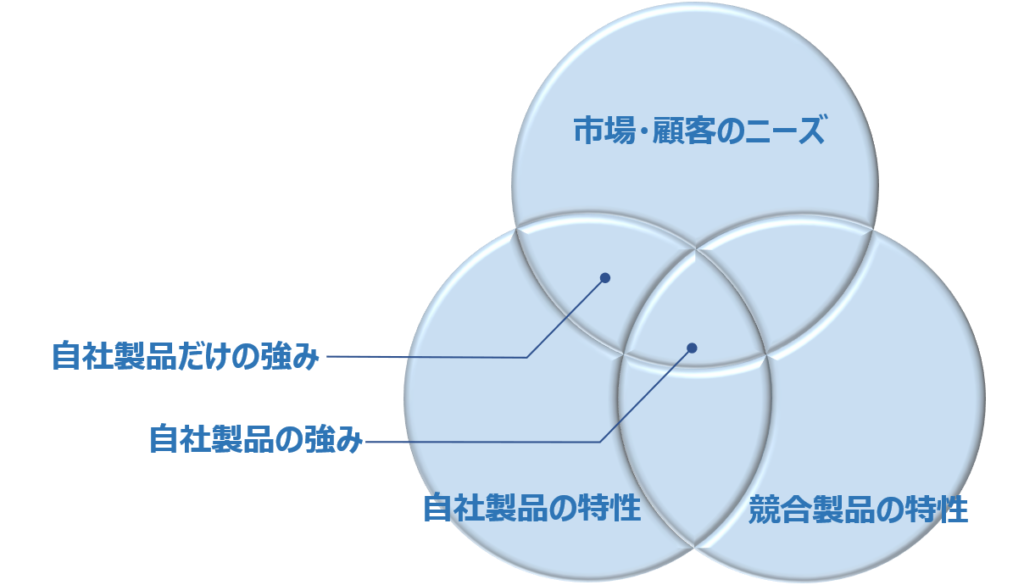
  1. 自社製品のロイヤルカスタマーを維持する
  2. 自社製品と競合製品が拮抗する顧客は自社製品のロイヤルカスタマーに育成する
  3. 自社製品と競合製品が拮抗する顧客が競合製品のロイヤルカスタマーになることを阻止する

上記を達成するために競合製品のロイヤルカスタマーおよび自社製品の売上寄与率の低い顧客に投下されているリソースを自社製品のロイヤルカスタマーと拮抗状態の顧客に再配分する必要があります。

マトリクス分析法を使えば1~3を定量化・可視化し、戦力量分析法により必要なリソース量を数値化することが出来ます。

“How can we quantitatively and visually allocate personnel after reducing the number of MRs through early retirement or other means?“

There are several approaches to consider based on the objective:

Ensure that the remaining personnel cover all customers.

  1. Exclude customers who would be left without an MR from the target list.
  2. Prioritize reallocation based on the market size of customers.
  3. Of course, the optimal solution depends on the specific objective.

If the purpose is to provide information about your company’s products, the remaining personnel should continue visiting all customers as before to provide the necessary information.

However, if the goal is to maintain current sales and further increase sales, none of the options 1 to 3 alone will suffice.

To maintain current sales and achieve further growth, the following actions are necessary:

  1. Retain loyal customers of your company’s products.
  2. Nurture customers who are evenly split between your company’s products and competing products into loyal customers of your company’s products.
  3. Prevent customers who are evenly split between your company’s products and competing products from becoming loyal customers of the competition.

To accomplish the above, it is necessary to redistribute resources currently allocated to loyal customers of competing products and customers with low sales contribution to your company’s products and those in a competitive state. By using matrix analysis, options 1 to 3 can be quantified and visualized, while the resource requirements can be quantified using a force analysis method.

医療法人の顧問をしている関係で多くの営業の方から売り込みをうけます。

情報収集は重要なので積極的に話をお聞きするようには勤めていますが、最近は営業代行などが増えており、ニーズの掘り起こしもせずアポ取り優先の電話も少なくありません。

昨日はベッドサイドでも簡易的に検査が行えるハンディタイプの検査機器の説明を伺いました。

営業担当の方は熱心に機器の素晴らしさを説明されるのですが、個人的には、自施設内の入院患者をスクリーニングによって外来受診へ誘導促進できる点に興味を持ちました。

人口減少によって市場としての医療圏は縮小傾向にあるため、先進の機器や腕の良い医師を揃えていていても待っているだけでは集患が難しくなっています。

潜在的な患者を積極的に発掘していく必要があります。

検査機器により、特定の属性にある患者群でスクリーニングを行った場合の検出率が分かれば、検査と外来診療の平均診療単価を掛けることで簡単に損益分岐が分かります。

マーケティングにおける有名な言葉の一つに「ドリルを買う人が欲しいのは『穴』である」という格言があります。

たどり着くところは、「どれだけメリットがあるか?」「なんぼ儲かるのか?」の世界ですね。

“What kind of holes can that drill make?”

As a consultant for a medical corporation, I receive numerous sales pitches from various sales representatives. Information gathering is crucial, so I make an effort to actively listen to their presentations. However, recently there has been an increase in sales agencies, and many of them prioritize appointment setting over uncovering needs.

Yesterday, I listened to a presentation about a handheld diagnostic device that allows for simplified testing at the bedside. The sales representative enthusiastically explained the advantages of the device. Personally, I became interested in its potential to screen inpatients within our facility and encourage them to seek outpatient care.

Due to a declining population, the medical market is shrinking, making it increasingly challenging to attract patients even with advanced equipment and skilled physicians. We need to actively uncover potential patients.

If we can determine the detection rate when screening specific patient groups using this diagnostic device, we can easily calculate the breakeven point by multiplying it with the average outpatient consultation fee. There is a famous saying in marketing, “People who buy drills want holes.” In the end, it all comes down to “How much benefit does it provide?” and “How much profit can be made?”

医薬品ビジネスにおいては公定薬価が定められる他に、情報提供の規制により製品力そのものでの差別化戦略が非常に難しいビジネスモデルです。

競争優位性を得るためには、製品力の他に経営資源の量やブランドイメージ、販売戦略などがあります。

マーケットシェア理論は、企業の市場内における競争地位や競争優位性を評価するための基本的な経済学的な理論です。

この理論は、企業が市場におけるマーケットシェアを分析し、企業の競争力や成果を測定します。

マーケットシェアは、以下のような理由で重要です。

①競争力の評価:マーケットシェアの高い企業は、顧客の需要を獲得しやすく、競合他社に比べて優位な立場にある

②成長の評価:マーケットシェアが拡大している企業は、市場への影響力が強く、成長の可能性が高い

③戦略立案:マーケットシェアは、競合他社との比較を可能にし、競争優位性を得るための戦略策定を可能にする

マーケットシェア理論は、市場における企業の地位や競争力を評価するための基本的な指標です。

しかし、マーケットシェアのみに基づく判断は限定的なものであり、市場の成長性や製品ライフサイクルなど他の指標との組み合わせが必要です。

“The market share is a limited indicator and needs to be combined with other metrics.”

In the pharmaceutical business, besides the establishment of official drug prices, there are regulations on information provision, making it a difficult business model to differentiate based solely on product strength.

To gain a competitive advantage, factors such as the quantity of managerial resources, brand image, and sales strategies are essential in addition to product strength.

The theory of market share is a fundamental economic theory used to evaluate a company’s competitive position and advantage in the market.

This theory analyzes a company’s market share in the market and measures its competitiveness and performance.

Market share is important for the following reasons:

Evaluation of competitiveness: Companies with a high market share are more likely to capture customer demand and have an advantage over competing firms.

Evaluation of growth: Companies with expanding market share have a strong influence on the market and have high growth potential.

Strategic planning: Market share enables comparison with competitors and allows for the formulation of strategies to gain a competitive advantage.

The theory of market share is a fundamental metric for evaluating a company’s position and competitiveness in the market.

However, judgments based solely on market share are limited, and it is necessary to combine it with other metrics such as market growth and product lifecycle.

アプリケーションは医薬品業界に特化した、独自に構築したアルゴリズムによる4つの分析手法による基本機能を有しています。

4つの分析は全て「医薬品販売データ」のみを読み込むことで行います。

「医薬品販売データ」は、市場/顧客と競合、および自社を含む3C情報のため、様々な分析を行うことが出来ます。

定量データと数式を組合せることで、分析から再現性のある計画作成まで、誰でも簡単に行うことが出来ます。

We have started developing a digital application to support the creation of execution plans in the sales department.

The application has basic functions of four analysis methods based on uniquely constructed algorithms that are specialized for the pharmaceutical industry.

All four analyzes are performed by reading only “pharmaceutical sales data”.

“Pharmaceutical sales data” can be analyzed in various ways because of the 3C information, including market/customers, competition, and your own company.

By combining quantitative data and formulas, anyone can easily perform everything from analysis to reproducible planning.

VポイントとTポイントの統合が発表されましたが、なぜこのような動きが生じるのでしょうか?

プレス発表では、よりユーザーが利用しやすくすることが目的とされていますが、企業活動としてはそれだけではないはずです。

マーケットシェア理論からこの統合劇を検証してみましょう。

統合の前後でシェア値の変化を比較してみました。

統合前の会員登録数ではPontaポイント、楽天ポイント、dポイントの3強型競争市場を形成しつつあり、このままではVポイントとTポイントは競争から脱落する可能性が非常に高い状況にあります。

しかし、VポイントとTポイントが統合すれば再び分散型競争市場となり、脱落の危険性は低くなります。

さらに、来期の市場成長率を10%と仮定した場合、1位のVポイントは2位のポンタポイントに差をつけることが出来ます。

市場ライフサイクルでは、脱落しないために常に上位2位までにランクインすること、自社の下位に位置する競合他社を射程距離圏外に突き放す必要があります。

今回のVポイントとTポイントの統合は生き残りをかけた起死回生の切り札と言えるでしょう。

“The Power Shift Resulting from the Integration of V Points and T Points”

The integration of V Points and T Points has been announced, but why is such a move occurring?

In the press release, the purpose is stated as making it more convenient for users, but as a business activity, there should be more to it than just that.

Let’s examine this integration drama from the perspective of market share theory.

I compared the changes in market share value before and after the integration.

Before the integration, the number of registered members formed a three-way competitive market among Ponta Points, Rakuten Points, and d Points, and there was a very high possibility that V Points and T Points would be eliminated from the competition.

However, if V Points and T Points integrate, it will once again become a decentralized competitive market, reducing the risk of elimination.

Furthermore, assuming a market growth rate of 10% for the next period, V Points, as the leader, will be able to widen the gap with Ponta Points, which is in second place.

In the market lifecycle, it is necessary to always rank within the top two positions to avoid elimination and to keep rival companies that are lower in rank out of range.

The integration of V Points and T Points can be considered a desperate and decisive measure for survival.

大手医薬品卸6社の2023年3月期の業績と、2024年3月期の業績予想の記事がありましたので、ライフサイクル分析の正確性を検証してみました。

ライフサイクル分析は、全体市場の増減による各社への売上およびシェアに対する影響を予測するものです。

来期の医薬品市場は1.5%程度伸びる見込みで試算した結果から、ライフサイクル分析による売上予測と、各社の2024年3月期の業績予想よる相関を検証しました。

結果は、R² = 0.998 と非常に高い相関を認めました。

各社、様々な要因から業績を予想しているはずですが、市場の増減とシェア値によるライフサイクル分析による予測値と、ここまで一致するとは想像していませんでした。

ライフサイクル分析の利点は業績予想の他にシェア値の試算が出来るところにあります。

一般的に市場が拡大すれば売上は向上しますが、シェアが低下し競争優位性を失っているケースがあるからです。

サンプル数が少ないので再現性があるか否かは今後の蓄積次第ですね。

“Is it possible to predict the performance of each wholesaler through life cycle analysis?”

I verified the accuracy of the life cycle analysis based on the performance of six major pharmaceutical wholesalers for the fiscal year ending in March 2023 and the performance forecast for the fiscal year ending in March 2024.

Life cycle analysis predicts the impact on sales and market share for each company based on the overall market growth or decline.

Based on the estimated growth of approximately 1.5% in the pharmaceutical market for the next term, I compared the sales forecast using the life cycle analysis with the performance forecast for each company for the fiscal year ending in March 2024, and examined their correlation.

The results showed a very high correlation with an R² value of 0.998.

Each company should be forecasting business results based on various factors, but I did not imagine that the forecast values from life cycle analysis based on sales and market share would match so well.

The advantage of life cycle analysis is that it is possible to calculate the market share in addition to the performance forecast.

Generally speaking, if the market expands, sales will increase, but there are cases where the market share has declined and the company has lost its competitive advantage. Since the number of samples is small, reproducibility depends on future accumulation.

「世界の乗用電気自動車(EV)市場の競争環境をライフサイクル分析してみました」

世界の乗用電気自動車(EV)の、2022年の販売台数は1100万台で、7台に1台はEVになり、急速に成長しています。

2023年度のEV販売台数とシェア値の変化を予測してみました(限られたデータソースからの分析であり参考傾向値としてください)。

国別では、中国が圧倒的に多く全体の63.6%、これに欧州の24.0%、米国の9.2%が続き、その他地域は3.2%です。

多者間競争のEV市場において、中国は安定目標値を超え、2位の欧州に対して2倍以上のシェアを有しており、安定的な強者として独走態勢に入っています。

メーカー別では日本にも正規ディーラーのあるBYDが1位となっており、2位のTesla と2強型競争市場となっています。

コストリーダーシップ戦略を行うBYDは、売上が増加しても純利益が減少していることか、ら戦略として持続可能であるのか疑問視をされていましたが現時点では成功しているようです。

上位10社のライフサイクル分析による販売台数とシェア予測では、各社販売台数は伸びるものの、5位以下では徐々にシェア値が低下し、競争力は弱まっていく結果になりました。

売上や利益だけを見るのではなく、競争市場における競合との戦い、すなわちシェア争いは非常に重要なファクターです。

市場が拡大し、自社の売上が順調に推移している裏で、実際にはシェアを落とし、脆弱な競争環境に進んでいる落し穴が潜んでいるかもしれません。

戦いの中で戦いを忘れた……とならないように注意が必要ですね。

“Conducted a lifecycle analysis of the competitive environment in the global passenger electric vehicle (EV) market.”

The sales of global passenger EVs reached 11 million units in 2022, with 1 in 7 vehicles being an EV, showing rapid growth.

I have made predictions for the sales figures and market share changes of EVs in 2023 (please consider these as reference values based on limited data sources).

In terms of countries, China overwhelmingly dominates with 63.6% of the total market share, followed by Europe with 24.0% and the United States with 9.2%, while other regions account for 3.2%.

In the competitive EV market, China has surpassed its stabilization target and holds more than double the market share of second-place Europe, establishing itself as a stable leader.

In terms of manufacturers, BYD, which also has authorized dealerships in Japan, takes the top spot, creating a duopoly competition market with Tesla in second place.

BYD, implementing a cost leadership strategy, has faced skepticism about whether its strategy is sustainable due to a decrease in net profit despite increased sales. However, at present, it seems to be successful.

According to the sales and market share predictions based on the lifecycle analysis of the top 10 companies, while each company’s sales figures are expected to grow, companies ranked below fifth place will gradually experience a decline in market share, resulting in weakened competitiveness.

It is important to note that the battle for market share, which means competition against competitors, is crucial, rather than solely focusing on revenue and profit.

While the market is expanding and your company’s sales are doing well, there may be pitfalls that are losing market share and leading to a weaker competitive environment. We must be cautious not to lose sight of the battle amidst the battle.

『目標の設定』

期間内に達成したい売上目標、新規顧客獲得数、既存顧客の維持・拡大など、具体的かつ測定可能な目標を定める

『目標達成のための戦略』

ターゲット市場や顧客セグメントの選定、競合分析、マーケティングメッセージの開発、販売チャネルの選択など、目標を達成するための具体的なアプローチや戦略を決定する

『活動計画の策定』

営業活動の予算の設定、営業手法やツールの選定、顧客へのアプローチ方法、営業活動のタイムラインなど、目標達成に向けて具体的な活動計画を策定する

『リソースの確保』

予算、人員、技術ツール、営業資料など活動計画を実行するために必要なリソースを確保する

『トラキングと評価』

実行した成果や課題点を把握し、必要に応じて計画を修正するためのフィードバックループを確立する

さらに、上司やチームとの連携や情報共有をする手段となる、共通言語としての標準化された理論とプロセスが必要です。

S.I Labは独自の特許技術により、営業担当者による活動計画作成プロセスをデジタル化によって定量化および可視化を実現します。


To create their own activity plan, sales representatives need the following elements:

  1. Goal Setting: Define specific and measurable goals such as sales targets to achieve within a certain period, acquiring new customers, and maintaining/expanding existing customer base.
  2. Strategy for Goal Achievement: Determine specific approaches and strategies to achieve the goals, including selecting target markets and customer segments, conducting competitor analysis, developing marketing messages, and choosing sales channels.
  3. Formulation of Activity Plan: Develop a concrete activity plan that includes setting the budget for sales activities, selecting sales methods and tools, determining customer outreach methods, and establishing a timeline for sales activities.
  4. Resource Allocation: Secure the necessary resources to execute the activity plan. This includes budget, personnel, technological tools, and sales materials. By securing the required resources in advance, the execution of the plan can proceed smoothly.
  5. Tracking and Evaluation: Regularly monitor and evaluate the progress of the activity plan. Sales representatives should assess achieved results and identify challenges, establishing a feedback loop to modify the plan if necessary.

In addition, coordination and information sharing with superiors and team members are crucial. Having a standardized theory and process as a common language for communication, S.I Lab uses its own patented technology to digitize and visualize the activity plan creation process by sales representatives.

あなたの特技は何ですか?あなたの強みはどこですか?

人生でことあるごとにこのような質問を受けてきたせいか、いきなり強み弱みをフレームに書き始める方がいますが、それは間違いです。

まず外部環境要因を洗い出し、つぎに内部環境要因を洗い出すことから始めましょう。

この時点では分析を行う必要はありません、出来るだけバイアスをかけずに要因を洗い出します。

付箋紙を使ったブレーンストーミングが有効です。

外部環境要因の洗い出しから始める理由は、外部環境は自社ではコントロールすることが出来ず、自社は常に外部環境の影響を受け、その結果、強みと弱みは相対的に変化するからです。

例えば英会話教室の例を挙げてみましょう。

内部環境要因≒自社の特性

  • 駅近の立地で通いやすい

一見、この特性は強みに見えますが、外部環境によっては弱みにもなります。

外部環境要因にリモート化の拡大があれば、駅に近いことは必ずしも強みとは言えず、固定費が掛かることで授業料を引き上げてしまうかもしれません。

また通える範囲の顧客しか獲得出来ないことになり、商圏を狭め機会損失を招きます。

強みとは他者にとって価値の提供となるものであり、価値がなければただの特性です。

さらに競合他社には提供が出来ない自社だけの価値が「自社だけの強み」になります。 SWOT/クロスSWOT分析によって、自社が必ず勝てる、絶対に負けないための場所、相手、立ち位置、すなわちSTPが決まります。