
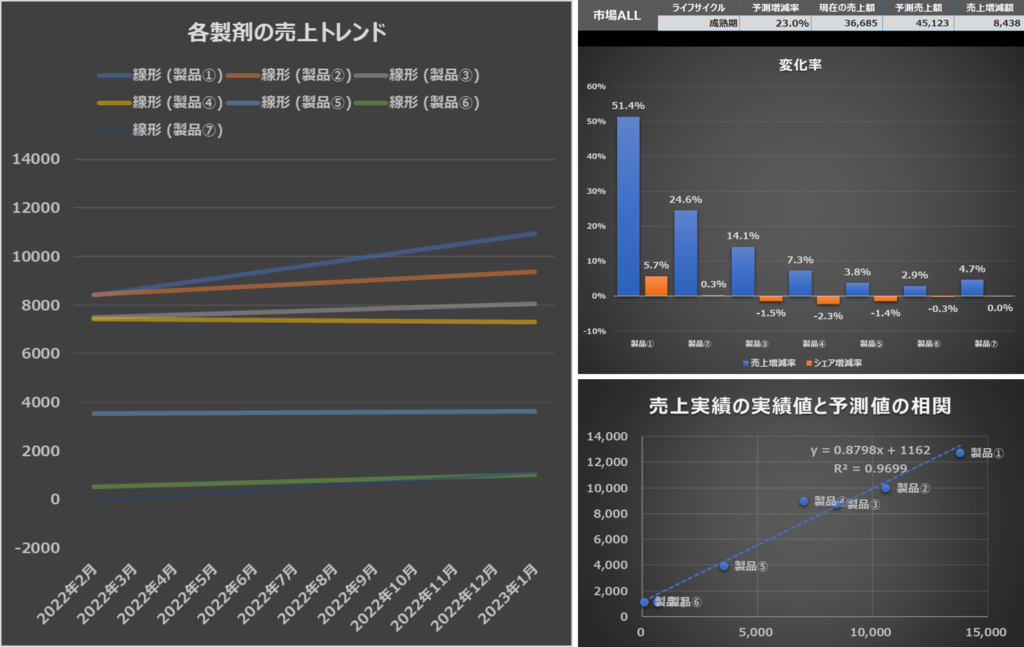
各製剤の売上トレンドはご覧いただいて分かるように、一位の製品から順に右上方向への傾きが大きくなっています。
すなわち売上(シェア値)が高い製品がより多く市場を獲得する割合が高いということです。
上位4製品のうち、製品④のトレンドは横ばいとなっており、現状の製品①、製品②、製品③の4強型市場から、既に製品③のシェア値の低下が予測されるため、今後は2強型競争市場が形成されることが予測されます。
製品⑤と製品⑥は絶対値は低いながらも上昇トレンドにあり、ニッチ戦略が上手く機能している可能性が考えられます。
その場合、最もリスクが高いのは、各競合製品からの攻撃目標になりやすい製品④となります。
2022年4月の総売上額と、2023年1月の総売上額から市場成長率を試算し、各製品の最高売上額とライフサイクル分析の予測値の相関を散布図にした結果、相関係数は97%と非常に高い相関を示しました。
市場のライフサイクルを評価するには、月次では期間が短いですが傾向は読み取れるかと思います。
また予測値との相関が高いということは、現在の営業活動のインパクトが得られていないことも考えられます。
“Verification of the Accuracy of Life Cycle Analysis”
I have examined the precision of life cycle analysis.
The inclination to the upper right direction increases in order from the top product. That is to say that indicating that products with higher sales (market share) tend to acquire a larger portion of the market.
Among the top 4 products, the trend of product 4 is flat, and the market share of product 3 is already expected to decline from the current 4 strong market of product 1, product 2, and product 3, so it is predicted that a two-strong competitive market will be formed in the future.
Products ⑤ and ⑥ exhibit a rising trend, albeit with lower absolute values, suggesting the potential success of a niche strategy.
In this situation, product ④ becomes the most vulnerable, as it becomes a likely target for attacks from competing products.
By calculating the market growth rate based on the total sales in April 2022 and January 2023, and plotting the scatter diagram between the highest sales figures for each product and the forecast values from the life cycle analysis, a very high correlation coefficient of 97% was observed.
Although the monthly evaluation of the market’s life cycle has a short timeframe, trends can still be discerned.
Furthermore, the high correlation with forecast values suggests that the current sales activities may not be having the desired impact.