「市場参入の条件とKGIの設定」
新規市場参入する際は、利益を得るに十分な市場規模があるか、市場が成長期にあるか、自社の競争優位性があるか、この3つが重要です。
市場規模が予め把握できる場合、KGI(Key Goal Indicator, 重要目標指標)としては、売上金額よりも市場占有率(マーケットシェア)を設定する方が合理的です。
市場の成長と競争力の評価
市場占有率をKGIとすることで、自社の競争力や市場での立ち位置を明確に評価できます。売上高では市場全体の成長や他社との比較が困難ですが、市場占有率は市場全体に対する自社の割合を示すため、競争力の指標として有用です。
長期的な戦略立案
市場占有率をKGIとすることで、短期的な売上目標よりも長期的な戦略立案が可能になります。市場占有率を維持または向上させるための施策を考えることで、持続的な成長を目指した計画を立てることができます。
マーケティング効果の測定
市場占有率を目標とすることで、マーケティング活動の効果をより正確に測定できます。新製品の導入やプロモーション活動が市場占有率にどのような影響を与えたかを分析し、効果的なマーケティング戦略を策定することができます。
資源配分の最適化
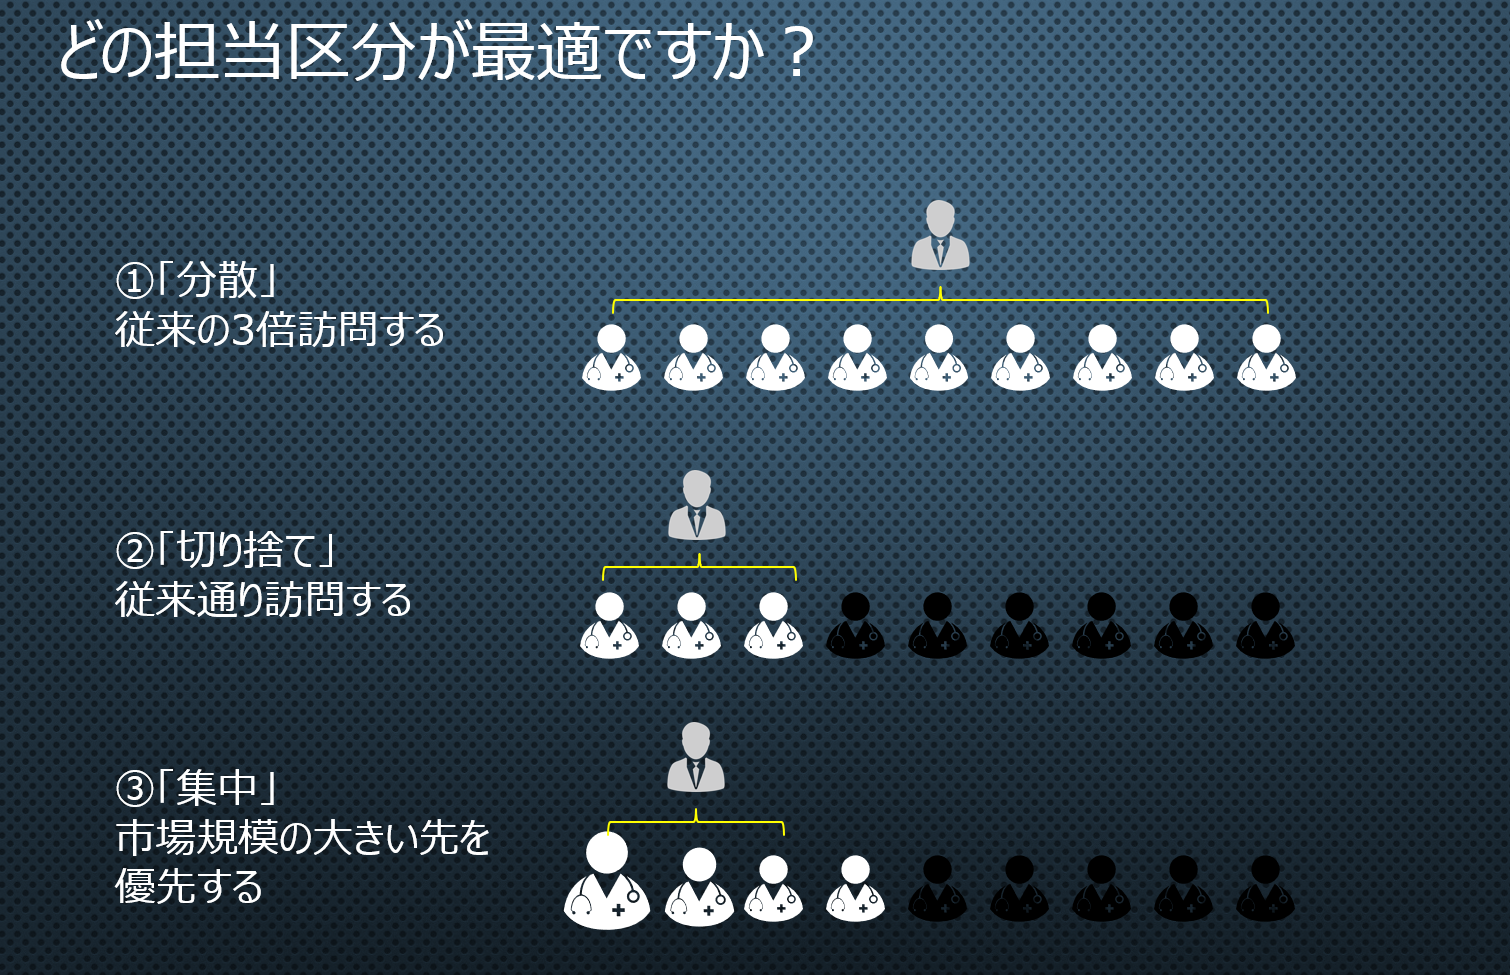
市場占有率をKGIとすることで、リソースの配分を最適化できます。市場占有率を高めるためにどの市場や顧客層に重点を置くべきかを明確にすることで、効果的なリソース配分が可能になります。
競争優位性の強化
市場占有率を高めることは競争優位性の強化につながります。市場占有率が高い企業はスケールメリットやブランド力を活かしてさらに競争力を高めることができます。
市場占有率をKGIとする場合、シェア理論、ランチェスターの法則、ゲーム理論は非常に有効なツールとなります。
シェア理論
市場での占有率(シェア)を中心に企業の戦略を考える理論です。市場占有率が高いほど、スケールメリットを享受しやすく、競争力が増します。
ランチェスターの法則
戦闘理論をもとにした市場シェアの戦略を分析するツールです。特に弱者が強者に対抗するための戦略に有効です。
ゲーム理論
競争相手との戦略的なやり取りをモデル化し、最適な行動を導く理論です。競合他社の動きを予測して戦略を立てるのに有効です。
これらの理論を組み合わせて活用することで、より効果的に市場占有率を向上させることが可能です。理論が補完し合い、多面的なアプローチが取れるのも利点です。
DXS Stratify®はシェア理論、ランチェスターの法則、ゲーム理論により、市場環境を定量化および可視化することで、意思決定支援を可能にします。