
医薬品販売データを用いて、顧客の属性分類に用いられるクラスター分析を行ってみました。
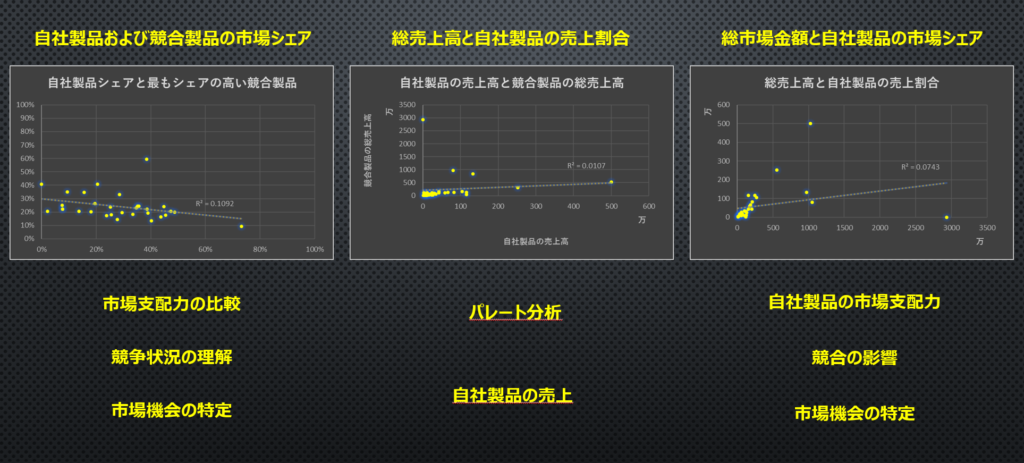
2軸による3種類の分析タイプの散布図を作成しています。
① 市場合計金額×自社製品の売上金額
この2軸からは、売上上位の顧客を特定し、優先度の高い顧客を判断することで、自社製品の市場占有率や競争力の理解をサポートします。
②市場合計金額×自社製品のシェア
この2軸からは、自社製品の市場支配力、競合の影響、市場機会の特定をサポートし
ます。
③自社製品のシェア×最もシェアの高い競合製品
この2軸からは、市場支配力の比較、競争状況の理解、市場機会の特定をサポートし
ます。
目的に応じて、どの要素による軸を掛け合わせるか、どのようにパラメーターを設定するのかは分析者に委ねられます。
さらに今回の分析手法では、どの分析結果も2軸の間に相関関係は認められませんでした。
つまりこれらの2軸の掛け合わせには論理的な根拠に乏しいため、正確な顧客ターゲティングが難しいと言えそうです。
Title: “Customer Targeting through Cluster Analysis”
We conducted cluster analysis using pharmaceutical sales data to classify customer attributes.
We have created scatterplots for three types of analysis based on two axes:
Total Market Amount × Sales Amount of Our Products
From these two axes, we can identify top-performing customers and make judgments on high-priority customers, supporting our understanding of market share and competitiveness of our products.
Total Market Amount × Market Share of Our Products
These two axes help us evaluate the market dominance of our products, the impact of competitors, and the identification of market opportunities.
Market Share of Our Products × Market Share of the Leading Competitor’s Product
These two axes facilitate the comparison of market dominance, understanding of competitive dynamics, and identification of market opportunities.
Depending on the objectives, analysts can choose which elements to combine on the axes and how to set parameters.
Furthermore, in this analysis, no correlation was observed between any of the analysis results along the two axes.
In other words, since there is a lack of logical basis for combining these two axes, it appears challenging to achieve accurate customer targeting using these combinations.